
- in Market Timing , Research by Cesar Alvarez
Market Cap vs. Crash Severity
Has the market sell-off and subsequent bounce treated all stocks the same? A good portion of the bull market move from 2009 to 2019 has been led by the big-cap stocks. Did they hold up better during the March sell-off? What about with the bounce? Did the smaller-cap stocks have a bigger bounce?
The Setup – February 19
At the S&P 500 high on February 19, I took all 503 stocks in the index and calculated their market capitalization. I then ranked them from high to low and created 10 deciles with each decile holding 50/51 stocks.
The Bottom – March 23
At the March 23rd bottom, I then calculated the average change in price for each decile.
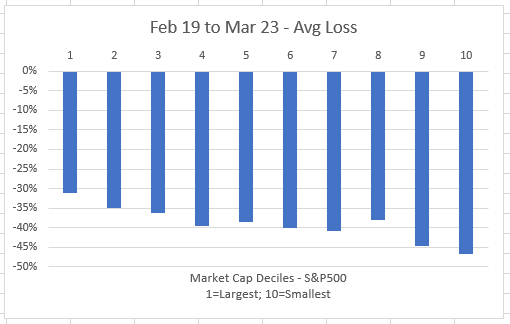
A clear pattern shows up here. The largest decile stocks had an average loss of 31%. While the smallest decile had an average loss of 47%. For the most part each decile is worse than the previous one.
April 17
Last Friday on April 17, I again calculated the change in price since February 19. Did the recovery bounce treat everyone the same?
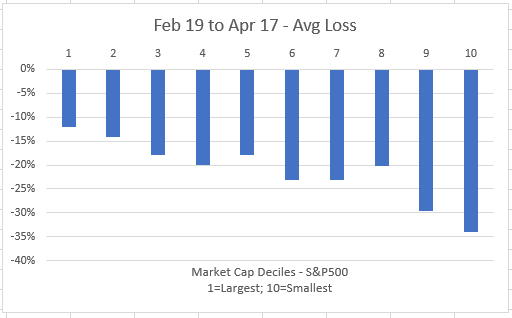
We can see that largest decile stocks are on average only down 12% from their price on February 19, while the smallest decile is still down 34%. That is a huge difference on how you view the market depending on what you are holding.
Percent Bounce from Low
As we all know, a 50% loss requires a 100% gain to get back to even, while a 25% loss needs only a 33% gain. Next, I wanted to find the change in price from March 23 to April 17.
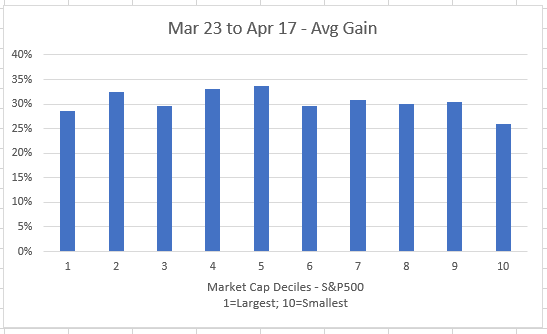
The average gain from the low is in a tight range of 26% to 34%.
Stocks above February 19 close
How many stocks in each decile are trading higher than the February 19 close?
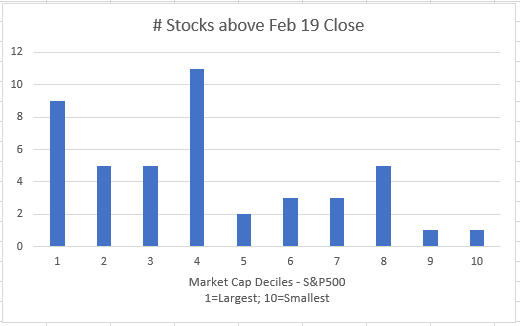
Again, we see a large cap bias. Surprising to me is the total number of stocks are trading higher.
June 3 Update
A reader asked for an update on the previous chart.
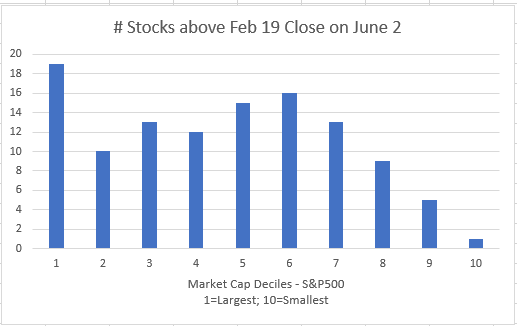
On April 17 with the SPX 15% below the February 19 high, 45 stocks were above their February 19 close.
On June 2 with the SPX 9% below the February 19 high, 113 stocks were above their February 19 close.
Final Thoughts
This helps explain why some non-traders I talked to are not that fazed by the market right now, while others are still all panicked about their losses. Depending on what end of the market-cap decile you are holding your average results are drastically different.
This was a fun little research project even it does not lead to any trading strategies.
Backtesting platform used: AmiBroker. Data provider: Norgate Data (referral link)
Good quant trading,
