
- in Research by Cesar Alvarez
How Bad Was 2018’s Volatility?
I have a Google Home in my bathroom that I play a morning routine while I shave, brush my teeth and get ready for the day. One step is to play The Indicator podcast from Planet Money. This morning they were talking about how “2018 was one of the most volatile years on record for the stock market.” Of course that caught my attention and I wanted to discover how they measured that. The volatility last year did not seem that bad given my trading since 90s. They mentioned the VIX and that had increased 157% from the previous year. But there was no other mention on how they came up with that statement. Well during my shower, I thought of all the “easy” ways they could have done it.
So how does 2018 volatility rank compared to all years since 1995?
Yearly Average VIX Reading
Since they mentioned the VIX, I figured let me do the easy thing and simply take the average VIX reading for each year.
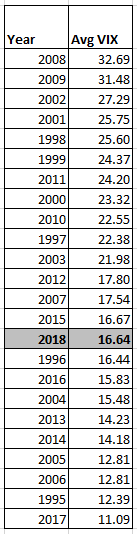
Well 2018 does not even make the top half. So clearly that is not it.
Average VIX Year Over Year Increase
Next up was comparing the year to year increase in the average VIX value.
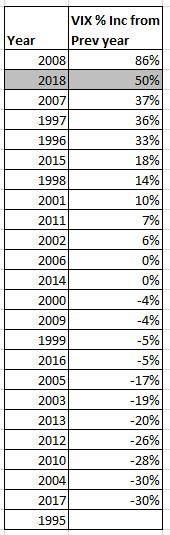
Well this came close. 2018 was the second biggest increase. But that was coming off the lowest VIX reading since 1995. Also, I did not get their increase of 57%. I only get 50%.
Average Absolute SPX % Daily Return
Maybe using the daily return of the SPX will get us somewhere. I took the absolute value to avoid up and down days canceling each other out.
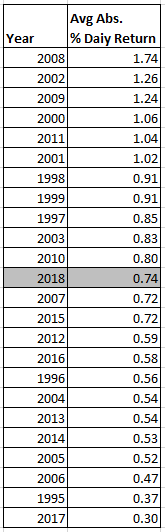
2018 falls in the middle.
Average Absolute SPX % Daily Return Down Days Only
Well, most people don’t care if the market does up a lot. Let us focus on down days only. What is average return of these days?
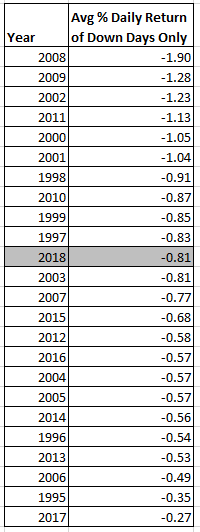
Again 2018, falls in the middle.
% Days Down For The Year
What if we look at the percent of days down for the year?
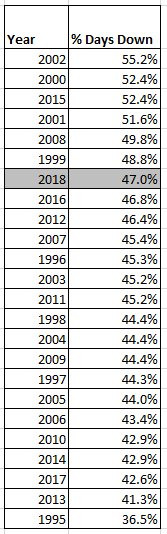
2018 now is the second worst since the bull market start in 2009.
Spreadsheet
File the form below to get the spreadsheet with the data used to generate these tables. You can use my data to slice it the way you want.
Final Thoughts
Was “2018 was one of the most volatile years on record for the stock market”? Not by any of my measures. What people have forgotten is how volatile the markets can be.
Backtesting platform used: AmiBroker. Data provider: Norgate Data (referral link)
Good quant trading,

Fill in for free spreadsheet:
