
- in ETFs , Rotation , Trend Following by Cesar Alvarez
SPY TLT Rotation
For my retirement accounts, I like to trade ETF strategies that require little work. One strategy we have all seen is the SPY/TLT strategy. There are many flavors of this concept. Some pick the best one over the last N months. Then there are different ways of allocating a portion of the portfolio to each. I currently don’t trade any SPY/TLT strategy and wanted to see if there was something interesting here.
General Notes
Test date range is from 2007 to 2018. All dividends are included in the results. Signal is at the end of the month and trade entry/exit is on first day of the month open. I only tested monthly evaluation. The reason for not testing longer periods is that all my other strategies evaluate monthly and waiting until the quarter or longer increases volatility of the strategy and the bias introduced by when you reevaluate.
Buy and Hold
We need a baseline to compare against. Here are the buy and hold numbers for TLT and SPY
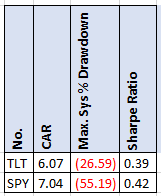
I did not realize how strong the bull market in TLT has been until I saw these numbers. Very close to same results of the SPY with half the drawdown.
SPY/TLT All in on the Best
This is the simplest idea of them all. I figured this would be a good target to beat.
Buy Rule
Each month you compare the N month return of each ETF and you buy the one with the highest value.
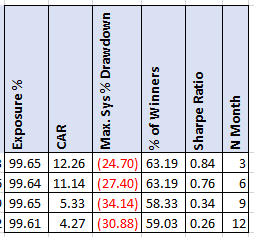
I always like it when there is a clear pattern to the results. The shorter the lookback the better the results. The 3-month numbers are definitely better than expected. It is also the only variation that made money in 2018. Being all in one ETF goes counter to what I would want in a strategy like this. The spreadsheet contains additional lookback lengths.
SPY/TLT Ratio
The next common method, is each month the strategy rebalances to a percentage in each ETF. For example, 75% in SPY and 25% in TLT. I tested all values for 95/5 to 5/95 in steps of 5 which you can see in the downloadable spreadsheet.
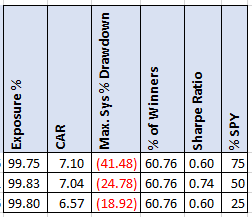
I was surprised on how well the 25% SPY/75% TLT did. This really shows the TLT bull run. But given the buy and hold numbers this should not be a huge a surprise.
SPY-TLT Universal Investment Strategy
This last method comes from this blog post Universal Investment Strategy (UIS). The basic concept is that the strategy is doing a walk forward to determine allocations. Each month the strategy tries all the combinations SPY/TLT ratios to determine which gives the best Sharpe Ratio. Then using that best allocation, trades it for the next month. Then reevaluate again at the end of the month.
A couple of notes. I could not replicate his results. I got close enough that I felt comfortable. To do some of the testing I wanted, I could not use AmiBroker’s built in walk-forward tester but had to write the code myself. My confidence that the code is right is high but not as high as in other posts. So, take these results with an extra grain of salt.
One aspect I liked from UIS, is the following from the post:
My algorithm uses the modified Sharpe formula Sharpe = rd/(sd^f) with f=volatility factor. The f factor allows me to change the importance of volatility.
If f=0, then sd^0=1 and the ranking algorithm will choose the composition with the highest performance without considering volatility.
If f=1, then I have the normal Sharpe formula.
If f>1, then I rather want to find SPY-TLT combinations with a low volatility.
This allows you to tailor the amount of volatility you want.
As to what to use as the lookback period for the Sharpe Ratio (SR), the post suggests 50-80 days. In my testing, the strategy looks for the best SR testing all look backs of (1,2,3,4,5,6,7,8,9) months with portfolio combinations of 100% SPY/0% TLT to 0% SPY/100%TLT in steps of 10.
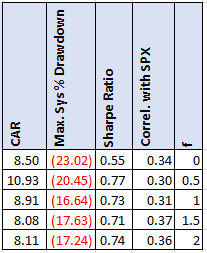
This table is sorted by ‘f.’ Notice how the MDD gets smaller the higher the f goes. Always nice to see when this works as expected. The spike in CAR at .5 is probably a fluke given the values around it. This method produces a consistent low MDD. Looking at the f=1 results to see how they are split each month.
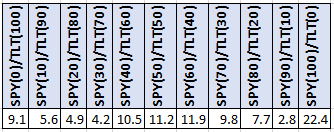
It is interesting that 22.4% of the time you are 100% in the SPY. The next highest allocation is SPY 60%/TLT 40% at 11.9%.
Caveats
A major issue to remember with these type of strategies is that they can be very sensitive to the day it rotates. Or if you rotate less frequently, when they start. Or to the length of your look back. For these reasons, I like to test on daily bars because then it makes parameter sensitivity testing much easier to do. I often see these strategies tested on monthly bars and think one cannot test how sensitive the parameters are.
Another issue is that TLT has been in a bull run since 2007. Now with the Fed raising rates, what will happen?
Spreadsheet
File the form below to get the spreadsheet with lots of additional information. See the results of all variations from the optimization run. This includes top drawdowns, trade statistics and more.
Final Thoughts
Even though the UIS method is complicated, it produced interesting results. Not sure if I would add this strategy to my others ones. What the author suggests is trying this on a bond ETF portfolio. I must give that a try and see what comes of it. Maybe the next post.
Backtesting platform used: AmiBroker. Data provider: Norgate Data (referral link)
Good quant trading,

Fill in for free spreadsheet:
