
- in ETFs , Rotation by Cesar Alvarez
ETF Bond Rotation
In my last post I discussed SPY/TLT rotation strategies. Today, I will be using the same ideas from the post but on a basket of bond ETFs.
The Basket
The first difficult decision one must make is what ETFs will be in the basket. What we choose here, can have a big impact on the results. I wanted to focus primarily on the US bond market. One factor I considered is picking ETFs with long histories. Lots of bond ETFs did not start trading until 2010 or later.
- JNK – SPDR Bloomberg Barclays High Yield Bond ETF
- SHY – iShares 1-3 Year Treasury Bond ETF
- TLT – iShares 20 Plus Year Treasury Bond ETF
- IEF – iShares 7-10 Year Treasury Bond ETF
- TIP – iShares TIPS Bond ETF
- BWX – SPDR Bbg Barclays International Treasury Bond ETF
I am sure several are you going why did you not include XYZ ETF. Well that is making my point. Deciding what to include or not include is not straight forward. Then there is the inclusion of international one. That was more out of curiosity to see how it impacted the results.
From the above list I tested three baskets
- JNK,TLT,IEF,TIP
- JNK,TLT,IEF,TIP, SHY
- JNK ,TLT,IEF,TIP, SHY,BWX
Testing Notes
Given the inception dates for these ETFs and that I needed one year of data, the backtest dates are from 1/1/2010 to 12/31/2018. All results include dividends.
Buy and Hold
How does a simple buy and hold strategy would do on each of these ETFs? I added AGG, iShares Core US Aggregate Bond ETF, because I figured that would be the easiest way to get bond exposure.
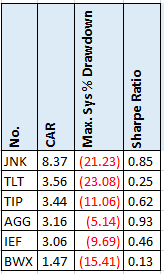
Given the low interest rate environment during this time, the CAR is as expected. Low. AGG with a CAR of 3.16 seems like a low bar to exceed. JNK produced a CAR higher than I expected but at much higher volatility.
All in on the Best
The simple rotation idea.
Buy Rule
Each month you compare the N month return of each ETF and you buy the one with the highest return.
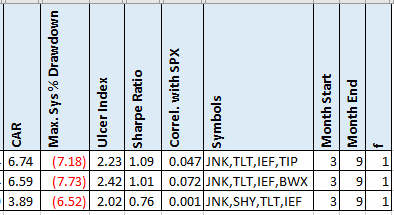
Basket comparison
Here are the results of using a 3 month look back on return.
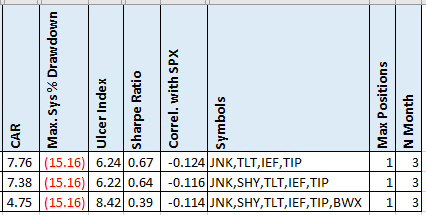
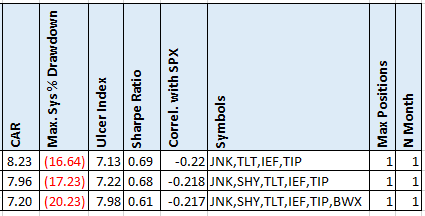
As expected, adding SHY did not change much. And adding the volatile BWX hurt the CAR. But if we change the look back to 1 month, the results are much closer.
Buy the Top 2
Instead of buying only the top ETF, in this case we will test buying the top 2 with equal allocation to both. The spreadsheet will include buying the top 3 & 4 also.
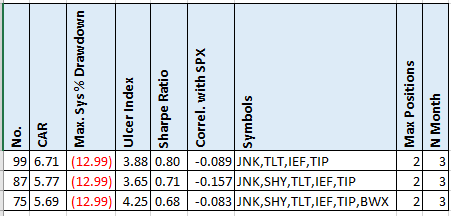
The returns came down but so did MDD.
Universal Investment Strategy
This last method is Universal Investment Strategy (UIS). See my previous post for a quick summation.
One aspect I liked from UIS, is the following from the post:
My algorithm uses the modified Sharpe formula Sharpe = rd/(sd^f) with f=volatility factor. The f factor allows me to change the importance of volatility.
If f=0, then sd^0=1 and the ranking algorithm will choose the composition with the highest performance without considering volatility.
If f=1, then I have the normal Sharpe formula.
If f>1, then I rather want to find SPY-TLT combinations with a low volatility.
This allows you to tailor the amount of volatility you want.
These are good numbers for the top to baskets. Now let us look at the top one with different values for f.
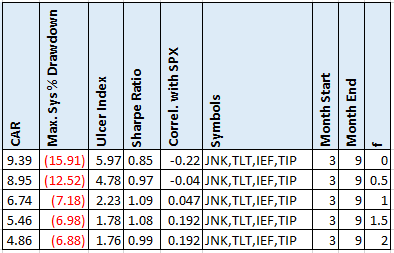
I love it when the results come out exactly as expected. As f increases returns go down and MDD goes down. That is working as advertised. I like the results for .5 f.
Spreadsheet
File the form below to get the spreadsheet with lots of additional information. See the results of all variations from the optimization run. This includes top drawdowns, trade statistics and more.
Final Thoughts
Again, the UIS produced the best results. Would I trade this? Not without a lot of additional analysis. I would want to test farther back and out of sample. That would require getting mutual fund data for funds similar to the ETFs. I would also want to analyze the UIS trade to see the typical allocation. Are you frequently in only one ETF? This is a good start though.
Backtesting platform used: AmiBroker. Data provider: Norgate Data (referral link)
Good quant trading,

Fill in for free spreadsheet:

