
- in Mean Reversion , Research , Stocks by Cesar Alvarez
January Effect on Stocks
A member of The Crew recently asked me about the January Effect and if had I done any research on it. I had not. I have tested the December effect, which is buying the worst stocks of the year on December 1st, Should You Buy the Best or Worst YTD Stocks.
From Investopedia, ‘The January Effect is a perceived seasonal increase in stock prices during the month of January. Analysts generally attribute this rally to an increase in buying, which follows the drop in price that typically happens in December when investors, engaging in tax-loss harvesting to offset realized capital gains, prompt a sell-off.” And then they state that the effect has largely disappeared. Time to find out.
Rules
Timeframe: 1/1/2007 to 12/31/2020.
Buy
- Last trading day of the year
- Stock is a member of the index (S&P500, NASDAQ 100, Russell 3000, Russell 2000)
- Buy the 10 stocks that have performed the worst for the calendar year
- Entry is on open on the first trading day of the year
Sell
- On the open of the first trading day of February
As a comparison, I will run the same test but buy the 10 stocks that have performed the best of the calendar year.
1-Month Results
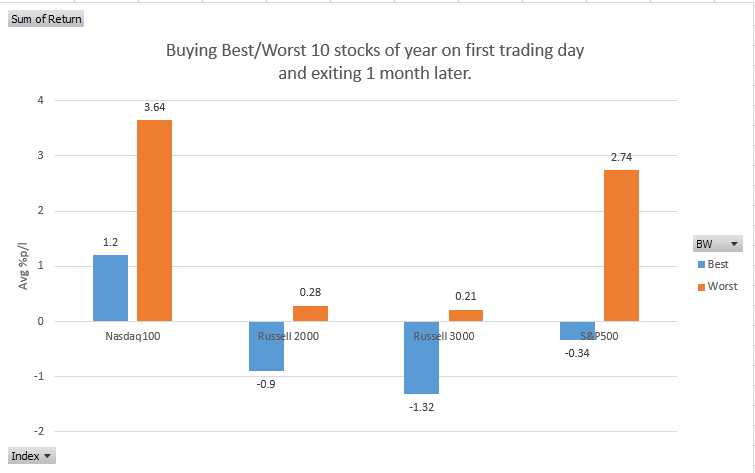
I did not expect these results to be that strong. Clearly buying the worst stocks of the year is much better. Looking at the yearly results, of the 14 years buying worst only did better 8 of the times. So, it is not a consistent winning strategy.
What about longer holds? Does this advantage disappear?
S&P500 and Nth-Month Exit
Looking at the S&P500 and exiting on the first of the month.
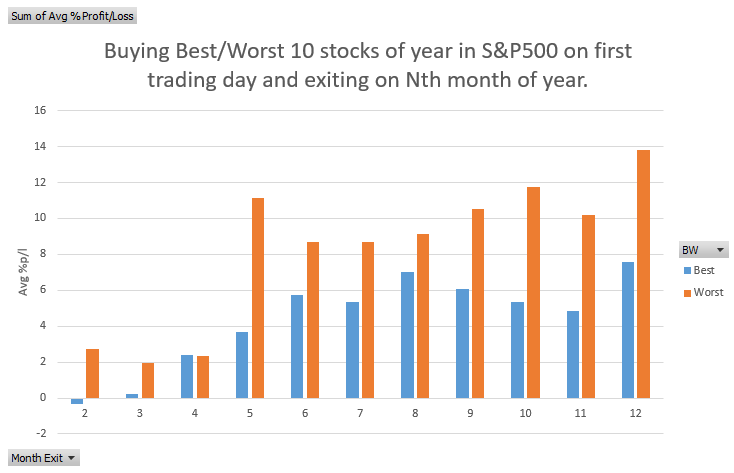
We see the pattern continues to hold up. Now I had to see the rest.
Nasdaq 100 and Nth-Month Exit
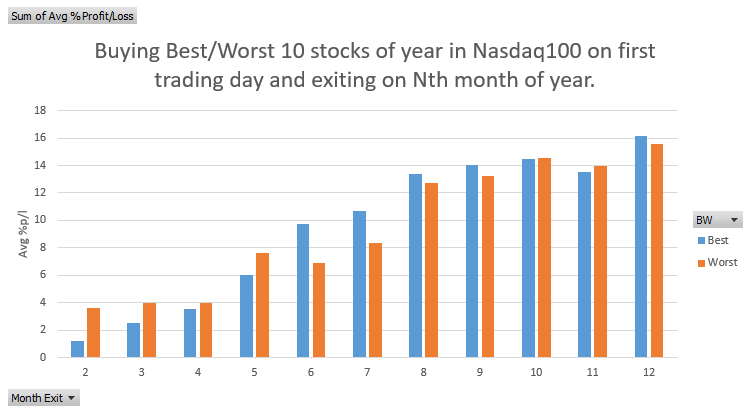
Here we see the pattern disappear after March. Is this because there are only 100 stocks? Not sure.
Russell 2000 and Nth-Month Exit
What about focusing on the smaller stocks like those in the Russell 2000?
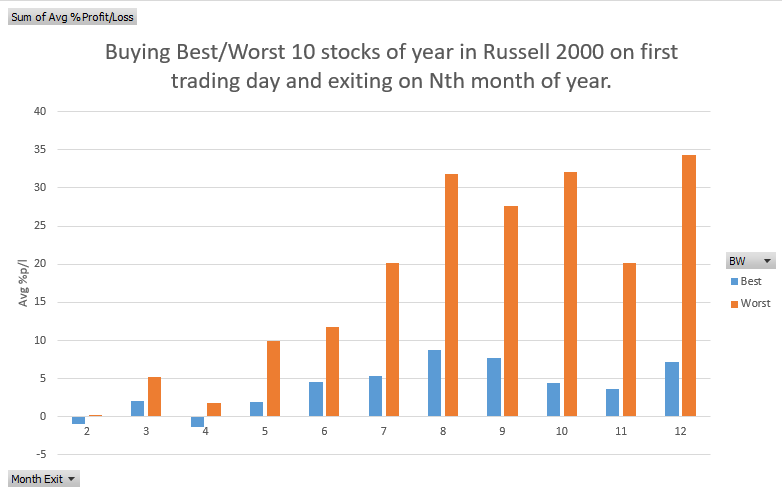
Now that is some edge! But I always think that a mistake was made. Investigating closely, the avg %p/l for the 10 worst stocks exiting on the first day in December is 34%. Looking at the tradelist, the two biggest winners are 3659% and 1612%. Removing those two winners the avg %p/l drops to -3%. While for the best 10, the biggest winner is ‘only’ 502%. Though this looks like there is a huge edge, it depends on 1-2 massively oversized winners. Not something I want to count on.
A Portfolio?
Looking at the S&P500 results, I see that exiting in December gave an average %p/l of 13.8%. What if we traded this as a portfolio? Unfortunately, the results are not very good. A compounded annual return of 5.1% and a maximum drawdown of 85%. Definitely not worth trading.
Spreadsheet
Fill in the form below to get the spreadsheet with lots of additional information. See the results of all variations from the optimization run. This includes top drawdowns, trade statistics and more.
Final Thoughts
As of the close on December 17, these were the worst 10 stocks in the S&P500 YTD: PENN, LVS, GPN, CTXS, ATVI, VTRS, MKTX, WYNN, IPGP, LW.
There does seem to be an edge on buying the worst-performing stocks of the year and holding a month. Holding longer the effect still appears to be there but becomes dependent on big winners. The effect does appear larger in small-cap stocks vs large-cap ones. Creating a standard portfolio out of this does not show promise. For options traders, this may be good long-term leaps play.
Backtesting platform used: AmiBroker. Data provider: Norgate Data (referral link)
Good quant trading,

Fill in for free spreadsheet:
