
- in ETFs , Market Timing , Research by Cesar Alvarez
Market will be up 9.7% in 3 months!
When this sell-off indicator triggers, it is correct 100% of the time! On average the market is up only 2.6% in 3 months.
OR NOT!
After big moves in the market, we often see “research” saying that “when the market has done X it will move Y%.” I had a reader send me such research asking for my thoughts on it. The indicator was that the market had closed down 3 days in a row with volume each day above the top Bollinger Band. When this happens, this is good for the market 3 months out.
There was no mention of the parameters used for Bollinger band. Or what “good” was exactly.
I will walk through my investigation of this idea. The first step is how I got that headline number. Yes, it was a cherry-picked number. That is the only reason people show these numbers is because they look great.
Test date range: Inception of SPY in 1993 to 2/26/2020.
On average the market is up only 2.6% in 3 months with 71% winners.
Rules Headline
- SPY closes down 3 days in a row
- Volume each day is above the 20 day and 1.5 standard deviation of the top Bollinger Band
- Buy at the close and hold 63 trading days
I take every signal even it overlaps with the previous signal. In general, allowing overlapping signals will improve your results and give you more trades.
Results:
Trades: 17
Avg % profit/loss: 9.7%
% Winners: 100
Two issues I have with this. First the low number of trades. Second, allowing overlapping trades. I care about the first signal. As of this post, we have had two consecutive signals: February 24 and February 25.
Rules No Overlapping Trades
What happens if we do not allow overlapping trades?
Results:
Trades: 12
Avg % profit/loss: 9.5%
% Winners: 100
As expected, the number of trades came down. I was surprised at how the overall numbers held up. But still too few trades.
Rules different parameters
Now I want to see if I can get more trades. I like to see over 50.
- SPY closes down 2 days in a row
- Volume each day is above the (5,10,15,20,25) day and (1.0,1.5,2.0,2.5) standard deviation of the top Bollinger Band
- Buy at the close and hold 63 trading days
Results
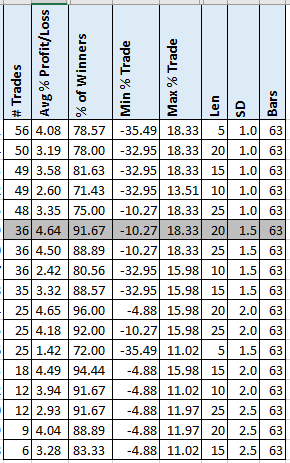
The highlighted row is our previous test but with only 2 days down. We get 36 trades and the results are still better than the normal 63 return of 2.6%.
Looking at the first few rows with trades over 47, we see most have better returns than the normal. But we are not near the eye-popping headline of “Market will be up 9.7% in 3 months!”
Spreadsheet
Fill in the form below to get the spreadsheet of the results. Also, includes other hold times.
Final Thoughts
I always take those indicator headlines with a big grain of salt. You never know how they got to it. And often they are missing details.
Understand these were cherry-picked results to get a point across. This research and post were quickly done, so the likelihood of coding error is higher.
The funny part is after this analysis, I would bet on the market being up 3 months from now. I was expecting conflicting results. But my trading is not based on random indicators that I just find. At the end of the day, I will keep following my strategies.
Backtesting platform used: AmiBroker. Data provider: Norgate Data (referral link)
Good quant trading,

Fill in for free spreadsheet:
