August 22, 2018

Pre-inclusion Bias: How to create a false strategy

In the previous post I described a simple rule to double the returns of a mean reversion strategy. In this post, I show how pre-inclusion bias can take a losing strategy and make it a winning one.

Recently I had reader send me the rules for a stock trend following strategy. He knew these are the strategies I have been researching lately. The rules were few and I had time, so I coded it up.

Continue reading

RSI2 Strategy: Double returns with a simple rule change

While playing around with a 2 period RSI (Relative Strength Index) mean reversion strategy, I came up with a very simple rule change with a much larger impact on the results than expected. I doubled the compounded annual growth rate and cut the maximum drawdown in half. That never happens.

In my optimization runs the best CAR went from lows 10’s to the low 20’s with this rule change.

Continue reading

July 11, 2018

Buy The Fear, Sell The Greed

The last few months, I have been busy doing research for Larry Connors’ new book, Buy The Fear, Sell The Greed. As always, it is fun and challenging to research for a book.

The book has seven strategies, trading both ETFs and stocks, with full rules and results. They are:

  • RSI Power Zones: Long ETF strategy
  • Crash: Short Stock strategy
  • Vol Panics: Short VXX strategy
  • VXX Trend Following: Short VXX strategy with over two month holds
  • Trading New Highs: Long Stock strategy
  • TPS: Long ETF strategy. Short ETF strategy
  • Terror Gaps: Long ETF strategy.

My favorite strategy is Crash because it is very similar to the short strategy I trade now. Those trades are hard to take. For each strategy there are good example trades and explanations of what the market was doing then.

Get the first chapter by clicking here.

The book is coming soon to Amazon.

Good quant trading,

June 27, 2018

Norgate Data Review

I am frequently asked what data provider I use and recommend for stocks. I have been using Norgate Data for four years and recommend them to anyone looking for data. This review will focus on US Stocks and AmiBroker integration which is what I use daily. Norgate Data has data for the Australian and US markets, forex and futures data. They integrate with AmiBroker and RightEdge.

Continue reading

June 13, 2018

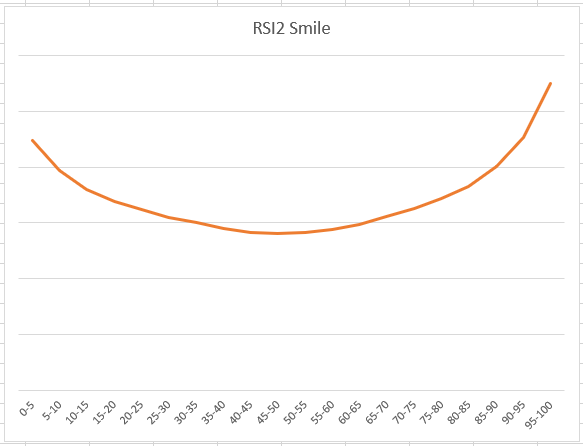
RSI2 (Relative Strength Index) Indicator Analysis

From my time with working with Larry Connors, I have become known for using the 2-Period RSI (RSI2) (Relative Strength Index) in my trading. I have written lots of blog posts that use it and I often use it in my personal strategies. One thing I like to do with indicators that I use frequently is a thorough analysis of them. Often, I find characteristics that I did not expect. Do you know about the RSI2 smile?

Continue reading

May 23, 2018

Trading the Equity Curve – More Ideas

A couple posts ago, I looked at Trading the Equity Curve and found interesting results but nothing that made me decide this works for me. Using the equity curve to decide when to stop trading a strategy just sounds like it should work. But for me it is always about testing. I cannot count how often I thought an idea would help the results only to see them dramatically hurt them. Remember test everything!

I have been thinking about other methods to use to trade the curve. I also wondered maybe it is the strategies I tested against that caused less than stellar results. I am working on a SP500 weekly mean reversions strategy with an average hold of three months.  Maybe new methods of trading the curve or the different strategy will give better results.

Continue reading

Mean Reversion Entry Timing

One of the first tests I did when I got AmiBroker twenty years ago was a mean reversion test. It was a classic set up, a stock in an uptrend, followed by a pullback. But the entry differed from what I do now. The entry waited for a confirmation of the trend back up.  The trade would enter when the stock crossed above the previous day’s high. The exit was also different. The exit was on a close below the lowest low of the last (2,5) days. The results were not very good, so I gave up on it. I did not do test entering on the open or on further intraday pullback or exiting on the bounce. If I had, I would have started my mean reversion trading several years earlier, which would have added several more years of large edges trading. Oh well, I was just a beginner researcher then.

Recently I got curious about waiting for confirmation before entering a trade.  Now that I know more about entries and exits, would it give good results. How would these results compare to waiting for further intraday pullback or entering at the open? Time to discover.

Continue reading

Trading rules that keep you trading

I have written the difficulty in trading and testing short strategies. I had stopped trading my short strategy because it was too hard to trade psychologically for me. About nine months ago, I revisited my short strategy to see how it had been doing since I stopped and of course it has been doing just fine even during these very bullish times.

As strategy developers we often add rules to improve some metric, for example CAR or Sharpe Ratio. But just as important are rules that will help you keep trading the strategy even if the rule worsens your metrics. That is the case of what I did with my short strategy. I added two new rules that made the results worse, but I believe will make it easier for me to trade in the future.

Continue reading

February 28, 2018

XIV Barbell Strategy

Well that was fun! I have been telling my trading buddy and anyone else that would listen that I fully expected XIV to open at zero one day. Now I did not expect it to happen so soon or the way it did. I trade a strategy that can be long XIV or long VXX or in cash. Because of the very likely possibility of XIV blowing up, I had constructed my portfolio using ideas from the barbell portfolio and this post, Taming High Return and High Risk. I was lucky and not in XIV when it did implode on Feb 6, 2018. Could a buy and hold trader of XIV made money even after the crash using these concepts? I was curious.

Barbell Portfolio

The idea of the barbell portfolio is that you put a small percentage of your assets (say 10%) in a very risky, high return asset like XIV. Then with the other 90%, you have it in something very safe like cash. Then at predetermined periods, you rebalance to be back to 10/90 allocation. These rebalance periods can be monthly, quarterly, semi-annual and yearly. What rebalance period you choose and the when can have a huge impact on your results.

Continue reading

February 14, 2018

Trading the Equity Curve

A popular method for determining if a strategy should be kept trading is trading the equity curve. What this means we apply an indicator, say 200-day moving average, to the equity curve. When the equity curve falls below this value we stop trading. We then continue to paper trade the strategy until it gets above the moving average and then trade it live again. The general idea being that you get out when the strategy is doing poorly and get back in when it is doing well. Also once a strategy breaks, this gives you a simple way of getting out of it.

Continue reading

1 6 7 8 9 10 19