
- in Mean Reversion , Stocks by Cesar Alvarez
RSI2 Strategy: Double returns with a simple rule change
While playing around with a 2 period RSI (Relative Strength Index) mean reversion strategy, I came up with a very simple rule change with a much larger impact on the results than expected. I doubled the compounded annual growth rate and cut the maximum drawdown in half. That never happens.
In my optimization runs the best CAR went from lows 10’s to the low 20’s with this rule change.
The Initial Pullback Strategy
Test range from 1/1/2007 to 6/30/2018.
I originally tested this.
Set up Rules
- Stock is member of the Russell 3000 index
- The as traded price is greater than $1
- The 21 day moving average of close*volume greater than $500K
- Close is greater than the 100 day moving average
- RSI2 is less than 10
Rule A gives us our trading universe.
Rules B & C are liquidity rules
Rule D is to keep us in uptrending stocks
Rule E is our sell off rule. Nothing fancy.
Entry Rules
- If we have a set up, then enter a limit order for the next day at 5% below the close. Order good for one day only.
- Only place enough orders so if they are all filled you are not in more than 10 positions
- If have multiple set ups, then rank from high to low by the 100 day historical volatility.
We enter on additional intraday weakness.
Exit Rules
- RSI is greater than 50 or after 10 trading days
- Exit on next open
Simple mean reversion exit of waiting for the bounce. No stops. You may have also noticed there is no market timing rule.
Got a guess on which rule I changed?
The Results
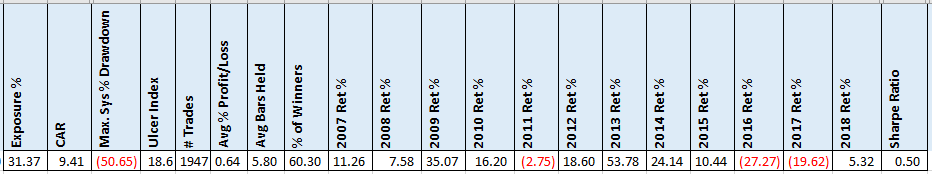
These numbers are really disappointing. I was expecting to have a large drawdown but the CAR was much lower than I expected. Also, the returns in 2016 and 2017 are bad.
The Simple Rule Change
I could have tried to add more rules but I did not want to down that route. Recently I have been thinking a lot about preinclusion bias into an index. And then hearing about how GE got removed from the DOW. That got me thinking about something that I read long ago that stocks removed from an index tend to better than those added. So I thought, how about only trading stocks that were in the Russell 3000 index in their past but currently are not.
The change in rule A, from above, becomes stock is not in Russell 3000 index but was so in the past. These are ex-index stocks.
Ex-Index Stock Results
My main concern was would there even be enough of these stocks to trade? Would we just get into a lot of losers?
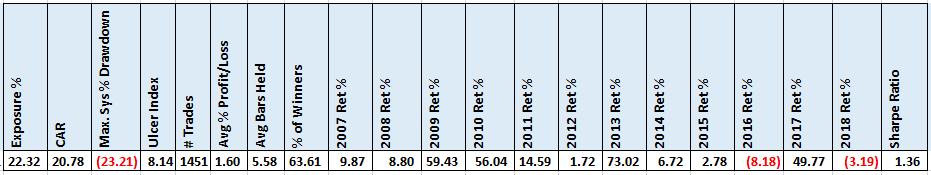
It is rarely that results like this happen. By every portfolio metric results got significantly better. Here are the improvements.
- Exposure down 29%. I was right about exposure being less.
- CAR up 121%. Holy cow!
- MDD down 54%. WTH!
- Ulcer Index down 56%
- Avg % profit/loss up 150%
- % winners up 5%
- Sharpe Ratio up 172%
Additional Numbers
I know what you are thinking. I simply cherry picked the best results. Here are the cherry picked numbers. The change in the rule is from RSI2 < 10 to RSI2 < 15.
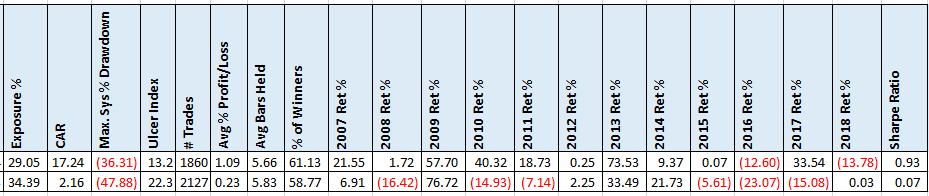
- Exposure down 16%
- CAR up 698%
- MDD down 24%
- Ulcer Index down 41%
- Avg % profit/loss up 374%
- % winners up 4%
- Sharpe Ratio up 1129%
Spreadsheet
File the form below to get the spreadsheet with lots of additional information. See the results of all variations from the optimization run. This includes top drawdowns, trade statistics and more.
Final Thoughts
Sometimes it is not more rules or better indicator but simply a small conceptual change in a rule that makes the big difference. Try this idea on your strategies and see if it helps. One downside to this rule change is that some trades are OTC stocks. Having the right data for this test is important that is why I recommend Norgate Data. A good mean reversion strategy with a simple rule change.
Backtesting platform used: AmiBroker. Data provider: Norgate Data (referral link)
Good quant trading,

Fill in for free spreadsheet:
