
- in Mean Reversion , Research , Stocks by Cesar Alvarez
Slippage and low liquidity stocks
Recently, I have been working on a strategy that trades stocks with low dollar turnover. The initial performance was attractive and I was liking the strategy. But there were two issues that I needed to deal with in the backtesting. How much slippage to add to these stocks. The strategy enters and exits on the open and while looking over the trade list, I noticed some trades entered at the low of the day and exited at the high of the day. From my trading, I knew this would not be a realistic price. Should these cases get extra slippage? What follows is how I try to account for these issues.
The Strategy
The rules of this strategy will not be shared here but will be shared on The Crew, my private trading group, in the next few months. The strategy is a mean reversion strategy scanning for a sharp sell-off. Then exits on the bounce.
Test range: 1/1/2007 to 12/31/2007
Original Results
For my testing, I normally use $.01/share for slippage and commission. I will be adding the additional slippage to these results.
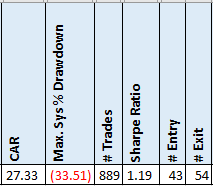
We will be focusing on CAR and MDD as we add slippage. The “# Entry” column is the number of trades entered at the open and that was the low of the day. The “# Exit” column is the number of trades the exited at the open and that was the high of the day. You can see these make up 11% of the trades.
Adding Percent Slippage
In my trading experience, when entering at the open and it also is the low of the day, either I only get a few shares at that price and then the rest of the order at a higher price. Or I get them all at a higher price. I do keep track in my trading the entry and exit prices of my trades and compare them to the backtested results. This allows me to see how much slippage I am getting. But I do not keep track of when they happen at the low or high of the day.
From my trade results on lower dollar-volume stocks, I typically see slippage around .1%. But these are even smaller than I typically trade so I would expect larger slippage.
For the following test, I added two types of slippage. One for if the stock did not enter/exit at the extreme of the day. Then a potentially higher amount if the stock did enter/exit at the extreme of the day.
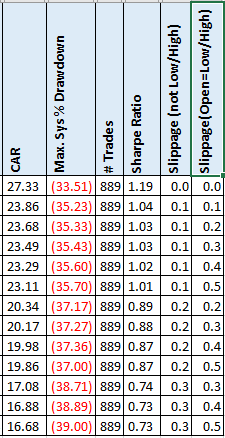
The top row is the original strategy without the extra slippage. Let’s look at row 4 which has a CAR of 23.49. In this run we use
- .1% slippage when the open does not equal the low of the day on entry
- .1% slippage when the open does not equal the high of the day on exit
- .3% slippage when the open equals the low of the day on entry
- .3% slippage when the open equals the high of the day on exit
As expected, the CAR comes down but not as much as I was expecting. And the MDD stays about the same.
Looking at the worst case I tested of .3%/.5% slippage, you can see how bad the strategy can get. The problem is we don’t know how much to expect.
What is interesting is that the entry/exit at the extreme really doesn’t have much impact on the results. Look at the .1%/.1% row with a CAR of 23.86. Now let’s look at the .1%/.5% row with a CAR of 23.11. Not much change even though we have a slippage of a half percent which is huge.
Spreadsheet
Fill in the form below to get the spreadsheet with lots of additional information. See the results of all variations from the optimization run. This includes top drawdowns, trade statistics and more.
Final Thoughts
Before I would fully commit to this strategy, I would trade at a small size until I had done about 10-20 trades. I would keep very close track of the slippage on both normal opens and opens at the extreme of the day. From there I could start to get feel for how much slippage is realistic for our backtesting. Even if it looked good then, I would keep close tabs on it when trading full size.
Depending on the slippage, the strategy can quickly go from an acceptable CAR to not.
Backtesting platform used: AmiBroker. Data provider: Norgate Data (referral link)
Good quant trading,

Fill in for free spreadsheet:
