
- in Mean Reversion , Stocks by Cesar Alvarez
Using strength to exit a mean reversion trade
I had a long-time reader, Cristian Franchi, send me a mean-reversion strategy that he wanted me to test and write about. What caught my attention was the rules differing from what I typically see and use. Different ways of measuring strength of a sell-off and volatility expansion. Along with a different type of exit being used on a mean reversion strategy. Not simply waiting for the bounce.
Rules
Test date range 2007 to 8/31/2020.
Buy
- Stock is a member of the S&P500 index
- 4-period RSI is less than 30
- The highest High in the last 21 days divided by the lowest Low of the last 21 days is greater than 1.04
- The r-squared value of the last 4 days is greater than .6
- The 4-day standard deviation of closes is greater than the 16-day standard deviation of closes time .3
- 126-day return of SPX is greater than zero
Rank stocks from lowest 100-day historical volatility to highest. Buy on the next open.
Rule (B) is looking for a sell-off.
Rule (C) is looking for stocks that have a large enough trading range in the last 21 days
Rule (D) is looking that the short-term sell off is clearly going down. This is an interesting way of checking for that I have not done before
Rule (E) is looking for volatility expansion. A different way than I would typically do
Sell
- Stock’s 4 period RSI closes above 65 for 5 or more days
- If still in position after 30 trading days
Exit on the next open.
The RSI Exit
I like the idea of the RSI exit. It is looking for a couple days of strength before getting out. Not just a bounce. A long time ago I tried similar ideas without much success.
Of course, I think are these optimized values? Are there better values? We will see later in the post.
Results
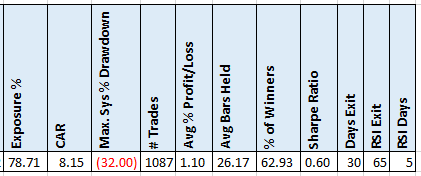
Not what I would call tradeable results.
Optimizing
Whenever I get a strategy, I want to know are the parameters that I was given overfit? What happens when I optimize them? What I really cared about was the exit, not the entry rules. So, my focus will be on those.
Optimization values:
- Stock’s 4 period RSI closes above [50, 55, 60, 65, 70] for [2, 3, 4, 5, 6, 7, 8] or more days
- If still in position after [20, 30, 40, 50, 60] trading days
Here are the top 5 results.
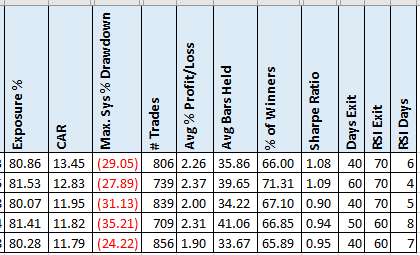
A big improvement but still not in the I would trade it level. Holding the position longer helped.
Nasdaq 100 Index
What if we trade stocks in the NDX?
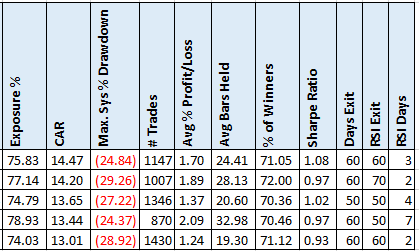
A slight improvement but again not enough.
Spreadsheet
Fill in the form below to get the spreadsheet with lots of additional information. See the results of all variations from the optimization run. This includes top drawdowns, trade statistics and more.
Final Thoughts
Even though this did not yield results good enough to trade, I did like the concept and execution of the exit. I must remember this when testing other strategies. It might be a good exit to use for a longer term strategy to tell when a stock has become over extended. For example, exit when RSI4 is greater than 90 for 5 days.
Backtesting platform used: AmiBroker. Data provider: Norgate Data (referral link)
Good quant trading,

Fill in for free spreadsheet:
