
- in Research , Trend Following by Cesar Alvarez
Stiffness Indicator Analysis
A reader pointed me the November 2018 issue of Technical Analysis of Stocks & Commodities to an article about a trend following indicator on S&P500 stocks. I liked the concept of the indicator and the article had backteted results and AmiBroker code. How could I resist not looking into this?
Little did I realize this would lead to Backtesting is Hard and How much does not having survivorship free data change test results?.
Stiffness Indicator Explanation
This is the general concept as explained from the article:
“The stiffness indicator basically attempts to recognize strong price trends by counting the number of times price was above the 100-day moving average (MA) during the indicator period. The premise is the fewer number of times price penetrates the MA, the stronger the trend.”
I like the above concept but the interesting twist is then
“I also introduced a volatility threshold that excludes minimal penetrations of less than0.2 standard deviations.”
The full formula for the Stiffness Indicator is as follows in AmiBroker. AFL file is provided in download below.
function Stiffness(value_array, moving_average_length, lookback_length)
{
     stiffness_ma = MA(value_array, moving_average_length) - 0.2*StDev(value_array, moving_average_length);
     percent_above = Sum(value_array > stiffness_ma, lookback_length);
     stiffness_ret = 100*(percent_above/lookback_length);
     stiffness_ret = EMA(stiffness_ret, 3);
     return stiffness_ret;
}
The addition of the 3 period EMA was in the code in the article but not mentioned in the article.
Replicating Results
As always, my first step is to replicate the results. I do this for several reasons.
- Make sure my code does not have bugs
- Make sure that their code did not have bugs
- Understand any potential data biases or data issues
Of course my first try at replicating the results were not even close. I emailed the author of the article to figure out what I was doing wrong. It was two main things. One, I had used some different settings in AmiBroker than he did. Two, he used stocks in the S&P500 as it existed when he ran the test. Meaning, his test had pre-inclusion bias.
My Public Service Announcement
If you are going to test against the S&P500 stock universe, use a data provider, like Norgate Data, that provides historical constituent data. You never know how your results will change when you use correct data.
The Results
His original test was doing a fixed dollar allocation of $10,000 and then calculating portfolio stats. I don’t like to test that way. If I do fixed dollar size, then I only care about trade level stats. Since I care about a portfolio, I changed his test to a portfolio. I also changed the test range to 1/1/2007 to 10/21/2018. These are the rules I tested
Buy Rules
- Stock is member of the S&P500 index
- The 100 day EMA of SPY is greater than the value two days ago. This rule is from the article
- The Stiffness Indicator(100,60) crosses above 95. This rule is from the article
Sell Rules
- The Stiffness Indicator(100,60) crossed below 50. This rule is from the article
- If in position after 84 trading days, exit. This rule is from the article
Enter and exit on next open. Position sizing is 10% per position with a maximum of 10 positions. Rank signals from low to high using 100 day historical volatility. This is my rule and have found this ranking works well for longer holding strategies.
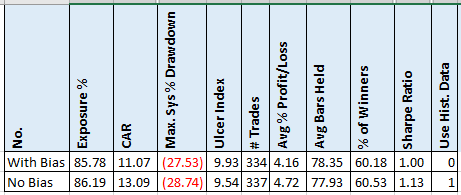
Here, testing with the bias universe of the current S&P500 stocks understated the true results.
Cross vs Above
The article used a cross of the indicator above 95. This means that the strategy can only get in on the day after this happens. Imagine that we cannot get into a stock XYZ when it crosses above 95 because we are full. Then in a couple of days we exit a position. The strategy will not enter XYZ because it did not just cross above 95. Now if the rule was changed to “the Stiffness Indicator(100,60) is above 95,” then the strategy would enter XYZ. I prefer to test with ‘above.’
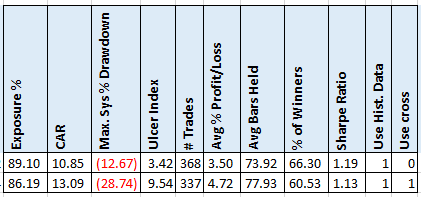
Using above lowered the CAR by quite a bit but also lowered the MDD. Investigating this more the main reason is the worst trade went from -28% to -19%. But even looking at the top 5 drawdowns, they are lower using Above.
Stop & Targets
Next I want to see if I can improve on the CAR of 10.85. The article mentions that this is not a complete strategy but that he would add stop and profit targets. My experience with longer term hold strategies shows that using a maximum stop loss and profit targets works well. I modified the rules as follows:
- (5, 10, 15, 20, 25)% maximum loss stop. Checked on closing price. Exit on next open
- (10, 20, 30, 40)% profit target. Checked on closing price. Exit on next open
- (2, 4, 6, 8) exit after this many months if still in position
- (NA, 50) stiffness exit. For NA waiting for one of the stops, loss, target or time to hit.
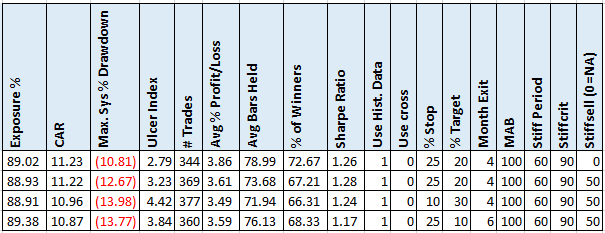
Comparing to the CAR of 10.85, only these 4 runs did better and not by a lot. What is good to see is the low DD. Not shown but in the spreadsheet, is using a Stiffness value greater than 95 improves the CAR a bit more to over 12.
Spreadsheet & Code
File the form below to get the spreadsheet with lots of additional information. See the results of all variations from the optimization run. This includes top drawdowns, trade statistics and more.
Also included is the AmiBroker AFL for the indicator function and plot.
Final Thoughts
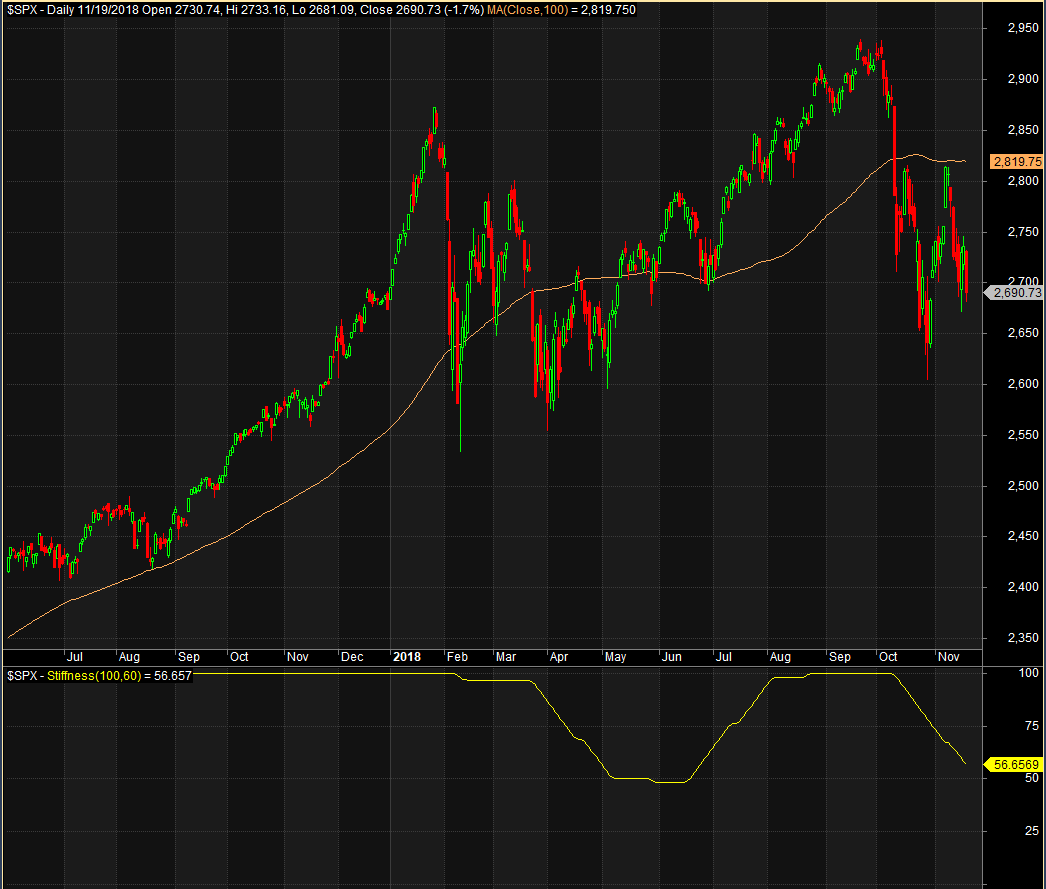
Conceptually I liked this indicator but my testing is not showing much of an edge here. Looking at the plot of the indicator, when a stock has been above its 100 day moving average for a while, the value is pegged at 100 as expected. But when you are in a strong bull market, you will have lots of stocks at 100. This does not help in distinguishing between which is best to be in. Then your ranking indicator becomes the critical part.
Being above or below the 100 day MA is binary. This indicator gives this some gradation which may help in catching transitions from below the MA100 to above it. Maybe a post for the future.
Backtesting platform used: AmiBroker. Data provider: Norgate Data (referral link)
Good quant trading,

Fill in for free spreadsheet and code:
