December 5, 2018

The Emotional Quant Curve

While writing my presentation for TradersFest 2018, I wanted to add the trader’s emotional curve. But looking at it closer, it did not capture my feelings as I go through the cycle of up and downs of trading a strategy. Here is my curve.

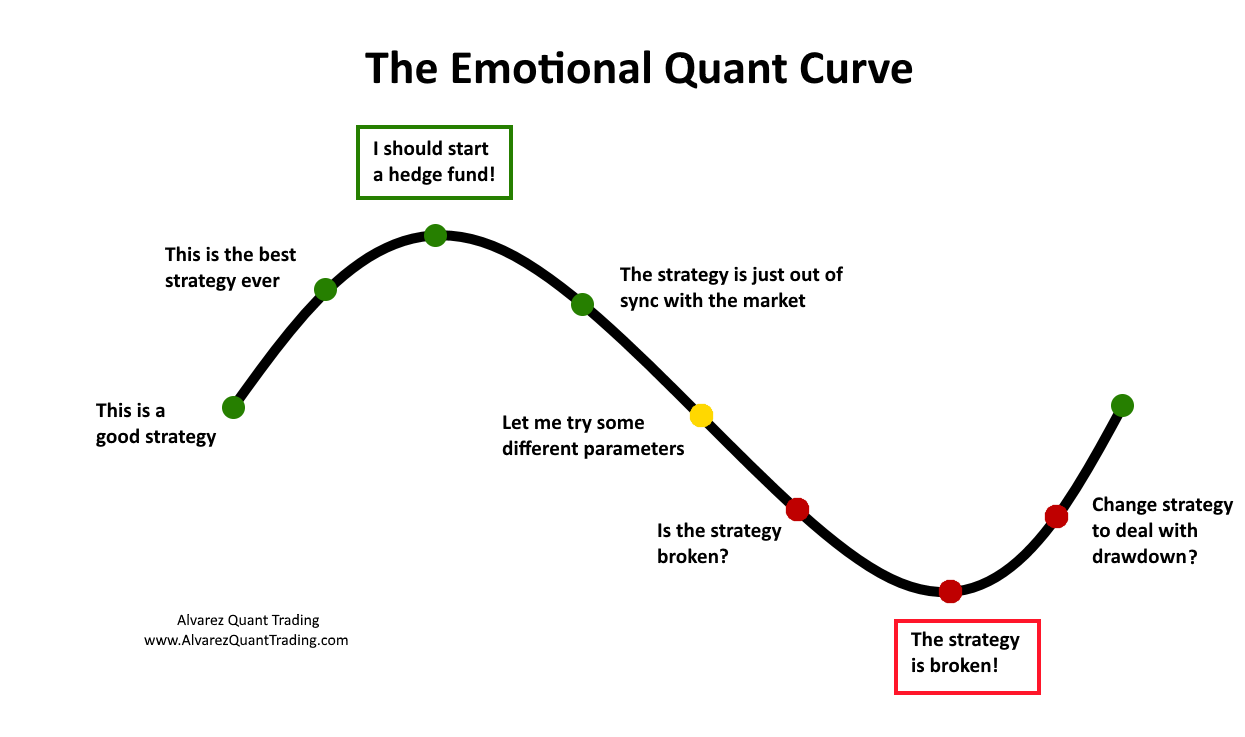
I have been on every part of this curve multiple times. October and November caused several strategies to go into the red part of the curve.

The top box of the curve, “I should start a hedge fund!” does not apply to me since I do not want to manage money. But lots of traders think about it and I chose that. For me, I would have changed it to “I can retire!

Where are your strategies right now?

Good quant trading,

Click Here to Leave a Comment Below

Tony Roylance - December 5, 2018 Reply

Very timely post, considering at this very minute I’m testing my “favorite” system with different time periods and parameters because it’s still “bullish”, and perhaps sub-consciously I’m trying to find settings that will make it flip “bearish” to be more in-sync with my (wrong-more-often-than-right) gut feeling about the market. One thing I struggle with as a system trader is When to Begin the System Test (perhaps it could be post idea!). Generally 12/31/1999 seems to be a common date, as it includes both the dot.com crash and financial crisis, however, if we step back a little bit further into 1998 we can include the Asia-Contagion mini-bear market. Thanks for the post!

    Cesar Alvarez - December 5, 2018 Reply

    When I start testing to change a strategy because of the last few months performance, I will usually go through the process and then sit on it for a couple months. When I review it again, most of the time I realize that the change is not in the best interest of the strategy. So I don’t make any changes.

    For stock strategies, I test back to 2007 for my in-sample and then use 2000-2006 as my out of sample.

Ray Lowe - December 6, 2018 Reply

The concept of using out of sample prior to in sample seems reasonable. I floated the idea with Howard Bandy while back. Let’s say he was against it but I cannot find exactly what he said. This topic is worthy of discussion. Do you have any comments or justification for using out of sample prior to in sample? Is there some risk or bias associated with doing it this way?

    Cesar Alvarez - December 6, 2018 Reply

    The reason for using the more recent IS is that I want my system to be ‘tuned’ more to recent markets. Imagine using the late 90s as your IS and mid 2010 as your OSS. Very very different markets. Markets change.

John Bennett - December 6, 2018 Reply

I trade two models for proprietary trading firm with my own account. One of my models is an opening range breakout system, and I found that in bear markets (defined as SPY below its 200 day moving average), it has a higher average trade, but also a much higher variance. I made a change where I cut trading leverage in half during bear markets, and its overall risk adjusted returns improved. You really have to look at everything!

    Cesar Alvarez - December 6, 2018 Reply

    I do the same thing in one of my strategies.

Ken Christian - December 6, 2018 Reply

Cesar, this is one of the best trading “curves” I’ve ever seen as it has accurately portrayed my journey with many different systems over my life. I’ve found one of the best ways to combat this, is to have multiple systems firing at the same time with no system over 30% of the portfolio. Along with this, I have a big chunk of money in a very conservative asset allocation strategy. Combining a solid asset base with the diversity and timing of multiple systems seems to solve a lot of problems for me, along with keeping my drawdowns emotionally reasonable and my returns above average. You can then use leverage to up the risk/return levels or to lower the volatility, to taste. Thanks for a great post.

    Cesar Alvarez - December 6, 2018 Reply

    I do basically the same thing. But it is hard to ignore when a strategy does poorly. Yes the portfolios of strategies may be doing OK, but seeing a strategy doing poorly always makes me want to reevaluate it.

Dionysos - December 14, 2018 Reply

Cesar, you have been doing an amazing amount of research. I’d go to the extent that every quant who thought about doing CT systems has seen your research. In situations like these, have you ever considered the go-with-the-flow method of trend following? In stocks it’s rather relative momentum. However, there’s no stock that makes its way to the sky without breaking out. The advantage is that you have a stop, but there s no upside potential. the way it can move is unlimited. Every day you look at your screen, you keep the shining green ones. The red ones can’t go any further. The backtests are less stellar. 15% over 2 decades. CAR/MDD 0.5. However, the game doesn’t change, it’s the same. Whatever makes a move has to breakout. You’re a 100% equities. How about bonds, currencies, commodities in addition. Buy what’s moving up, sell what’s heading down. It’s risk allocation. No parameter setting, because it just doesn’t matter. If stuff trends, any parameter will do. It’s Med Faber stuff, how the endowments do things. What do you think? You were the pioneer on MR in the 1990-2014 phase were big money was made. Will it ever be that way? How could I convince you to look at some trend following stuff in combination with asset class rotation?

    Cesar Alvarez - December 14, 2018 Reply

    I do test and trade trend following strategies and asset rotation strategies. Yes, I understand that conceptually you just buy the stocks going up and get rid of the dogs, but the testing of that simple idea does not produce that great of numbers. Maybe I should just start publishing them and see what people think.

Leave a Reply: