
- in Research , Rotation by Cesar Alvarez
Monthly Rotation – Closeness to $10
It is funny that my last post, Brazilian Jiu-Jitsu & Trading – Shiny New Toy, because this post is definitely chasing a shiny toy. I was reading the August 2019 Technical Analysis of Stocks & Commodities issue and came across the article “Swing Trading 10-Point Breakouts.” The basic concept was looking for stocks basing under a multiple of $10, then buy when it closes about that multiple. For example, the stock is trading at $29.50. Then closes at $30.25, buy it. I am thinking there is no way this can work. My curiosity got the better of me and I was off chasing the Shiny New Toy.
The Rules
First let me be up front and say I am not testing exactly what is in the article. Any results I find do not apply to what was in the article. I wanted to see if this concept could be applied to my trading.
Test date range 1/1/2007 to 7/31/2019.
Buy Rules
- It is the last day of the month
- Stock is member of the Nasdaq 100.
- Close is above the 200-day moving average
- The close of the $SPX is above the 200-day moving average
- Rank stocks by closeness to price under a multiple of 10
- Rank value = The remainder of Close divided by 10
- Here is an explanation Fun With Modular Arithmetic
- Buy the top 10 ranked stocks on the next open
Why the Nasdaq 100? I was doing this on an airplane with my slow laptop. Picking a small universe made the code run faster. As to the next two rules, I wanted to focus on up trending stocks in a bull market.
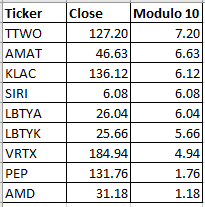
The ranking. Here is an example I hope helps. They are sorted by highest ranked stock on the top. If we had open a new position, then in this example we would by TTWO
Sell Rules
- It is the last day of the month
- Sell on the next open
Ranking Testing
When testing a ranking method, I like to test in both directions. This lets me see if there really is anything to the method. Here, ranking with the highest modulo should give the best returns. Thus ranking with the lowest modulo should give the worst returns.
If the ranking method really does not find good stocks, then those two rankings will produce similar results.
WTF?!?! It really does work!
It took a lot of effort not to scream in my airline seat when I saw these results.
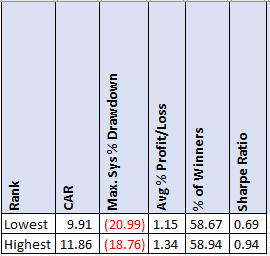
As a good paranoid researcher, I assumed I had made a mistake. But after checking and rechecking my code several times, it was correct. Now, there is not a huge difference there in CAR. It could be random noise and they just fell that way.
But even the maximum drawdown is smaller.
S&P500 Stocks
Well does this hold on S&P500 stocks?
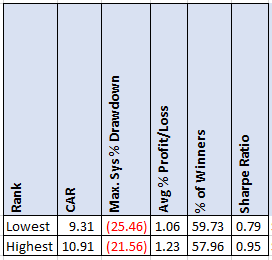
It does! Again, little difference in CAR but the MDD is smaller.
Russell 1000 stocks
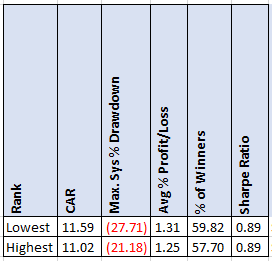
Now the CAR finally reverses and is much closer. But the MDD is better
Random Ranking
At this point I am thinking is this any better than random ranking? Instead of ranking by modulo 10, I will randomly pick 10 stocks. We are still keeping the MA200 rules.
Running 500 runs on the Nasdaq, we get the following.
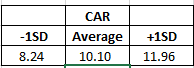
Our original Nasdaq results for CAR are 11.86 for Highest rank and 9.91 for Lowest rank. These results are within one standard deviation of random ranking.
Sorry but nothing here. Keep on going.
In practice I would want to see my results at least 3 standard deviations away. Preferably 4.
$19 vs $99
What I was thinking the entire time was a stock at $19 is 5% below $20. While a stock at $99 is 1% below $100. But ranking wise they are the same. That makes little sense
Not ready to give on this and the fact that I was still on the plane, I decided to try something new.
Price Buckets
I added a new rule. The Original Close of the stock had to be in a particular range. I tested these ranges
- NA – The original test
- Under $50
- Between $50 and $100
- Over $100
Yes, these does not solve the $19-vs-$99 issue but I wanted to see if it made any difference.
Under $50 Results
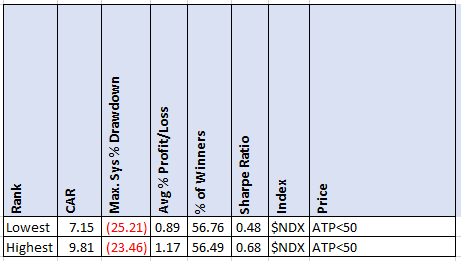
These are worse both for the CAR & MDD.
Between $50 & $100 Results
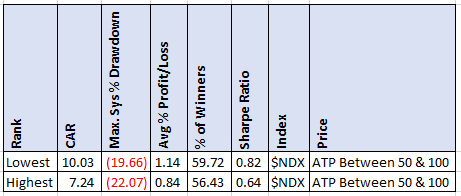
Again nothing here.
Over $100 Results
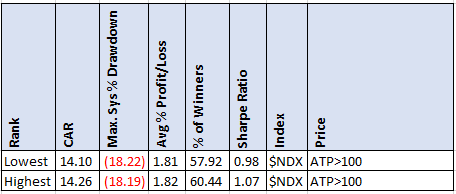
Wow this took me back.
The CAR is over 2 standard deviations from the random rank CAR. But there is little difference between the two ranking methods.
Now if you are smarter than I am, you probably figured this out already. It took me some time to realize what is going on between the ranking results (besides little difference in them). With starting with 100 stocks and then filtering by the 2 MA200 rules and requiring the stock to be over $100, we are basically trading the same stocks.
Would trading only high-priced stocks work? Maybe rank by price? The next post might be this wild idea. Edit 9/25/2019: Well, I could not leave it alone and did test it. Read The Simplest Momentum Indicator
Spreadsheet
File the form below to get the spreadsheet with lots of additional information. See the results of all variations from the optimization run. This includes top drawdowns, trade statistics and more.
Final Thoughts
Even though these results produced nothing tradeable, they reinforce the idea of testing against a baseline to see if the indicator is adding anything over throwing darts.
Normally I would not test an idea like this because it just seemed too strange to work. But I got drawn in by the Shiny New Toy syndrome even if it was an odd-looking toy.
Doing research that you know will very likely not work is OK. The problem is that we often go down this rabbit hole too far.
Backtesting platform used: AmiBroker. Data provider: Norgate Data (referral link)
Good quant trading,

Fill in for free spreadsheet:
