
- in ETFs , Trend Following by Cesar Alvarez
Trend-following vs. Momentum in ETFs
In Tactical Asset Allocation (TAA) or Dual Momentum (DM) strategies, they often will use trend-following or momentum to decide whether to invest in asset or not. I have two questions. One, how often does either trend-following or momentum out-perform buy and hold? Two, of the two which one out-performs the other more often?
Trend-Following Rules
Buy
- Last day of month
- Close is greater than the 10-month moving average
- Buy on open of next day
Sell
- Last day of month
- Close is less than the 10-month moving average
- Sell on open of next day
Momentum Rules
Buy
- Last day of month
- The 10-month return is greater than zero
- Buy on open of next day
Sell
- Last day of month
- The 10-month return is less than zero
- Sell on open of next day
The two most common values for the lookback are 10 and 12. In the spreadsheet I will also have results for lookbacks of 3, 4, 5, 6, 7, 8, 9, 10, 11, 12, 13, 14 and 15.
Testing Info
Dates: 1/1/2006 to 9/30/2019
I selected a common list of ETFs used in TAA & DM strategies. The list is AGG, DBC, EEM, EFA, GLD, HYG, IWM, LQD, QQQ, SPY, TLT and VNQ.
What are the metrics
The hard part about this test is how to decide if one version is better than another. I did not want to focus on simply one metric, like Sharpe Ratio, because it does not capture everything that I want.
The metrics I will be using are
Compounded Annual Rate (CAR): Annual growth rate of portfolio. The higher the better
Risk Adjusted Return (RAR): CAR divided by Exposure %. The higher the better
Max. system % drawdown (MDD): The largest peak to valley percentage decline experienced in portfolio equity. The lower the better.
Ulcer Index (UI): Square root of sum of squared drawdowns divided by number of bars. The lower the better.
Sharpe Ratio (SR): The ratio is the average return earned in excess of the risk-free rate per unit of volatility or total risk. The higher the better.
Yes, several of these metrics are correlated. For example, MDD & UI. But in my testing winning in one metric does not guarantee winning in the other similar metric.
When comparing two methods, each metric will be compared and if it exceeds by 15% then it gets one point. Why 15%? At 10% difference, I consider this noise. At 20%, I believe it is better. So I split the difference.
If the method gets 3 or more points, I will consider it better.
SPY Momentum vs Buy and hold
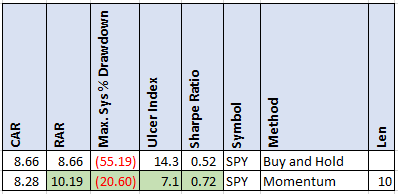
The green cells are those that momentum beat buy and hold by over 15%. Momentum beat 4 times, which means it is better than buy and hold.
SPY Trend-Following vs Buy and Hold
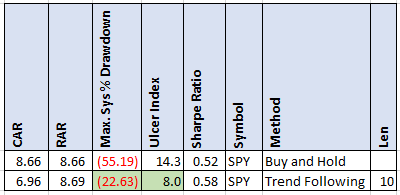
Trend following only beat on two of the metrics. Overall it did not beat buy and hold.
SPY Momentum vs Trend-Following
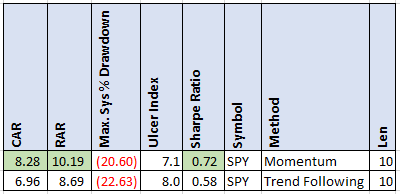
Now let’s compare the two methods. Momentum wins for three of the metrics while trend following does not win any.
On the SPY, momentum is clearly better.
Results on all 12 ETFs vs Buy and Hold
Momentum (highlighted rows below) beat buy and hold for seven of the ETFs: DBC, EEM, EFA, HYG, IWM, SPY and VNQ.
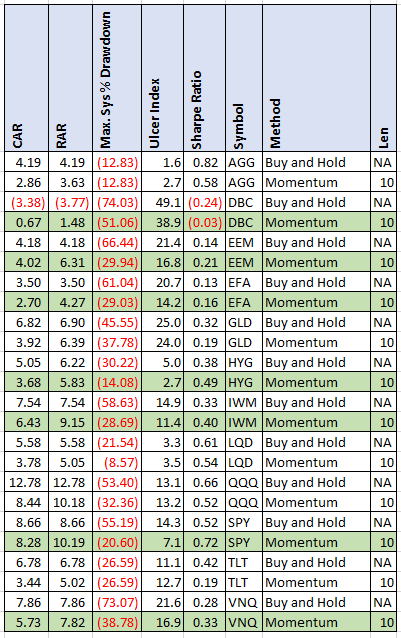
While trend-following (highlighted rows below) beat buy and hold for four ETFs: DBC, EFA, HYG and LQD.
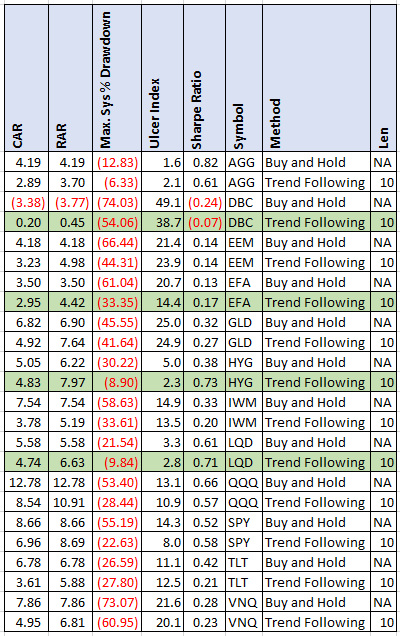
Buy and hold (highlighted rows below) was not beat by either Momentum or Trend Following for AGG, GLD, QQQ and TLT.
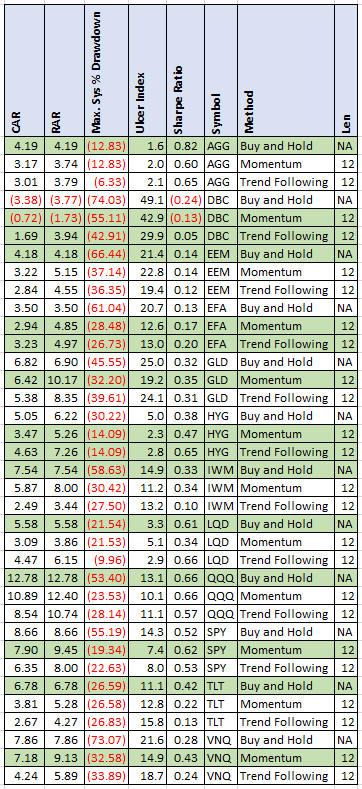
12-Month Lookback
Do the results change much with a 12-month lookback, which is also popular?
They get slightly worse. With momentum only winning 6 times and trend-following 3.
Here is the table with the highlighted winner.
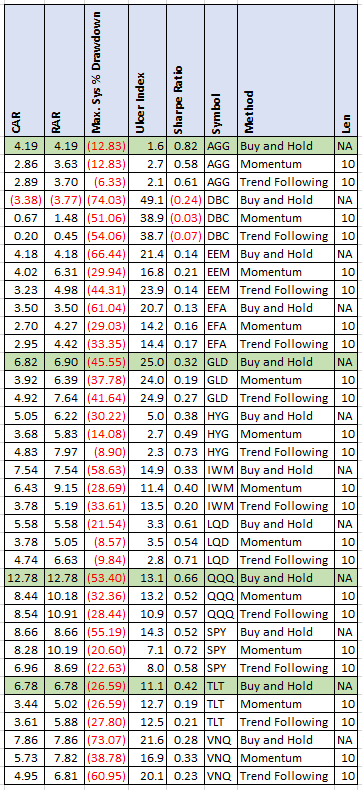
Momentum vs Trend-Following
My last question was which beats the other the most times. For this comparison, a strategy got one point if it was 15% better in the metric comparison. The strategy with the most points wins. These results are for a 10-month lookback.
In this comparison, momentum won 5 times: DBC, EEM, IWM, SPY and VNQ. While trend-following won 6 times: AGG, GLD, HYG, LQD, QQQ and TLT. This is interesting considering that when comparing to buy and hold, momentum won more often.
Using a 12-month lookback, momentum wins 6 times while trend-following wins 5.
Spreadsheet
Fill in the form below to get the spreadsheet with lots of additional information. See the results of all variations from the optimization run. This includes top drawdowns, trade statistics and more.
Final Thoughts
The first thing to remember is that the results can change dramatically depending on what metrics one uses and how one decides one strategy is better than another. Personally, I would favor MDD and UI more because these are what I care about more than CAR.
I was expecting both methods to beat buy and hold more often.
As to if momentum or trend-following is better, there was no clear winner. An interesting next step would be using them both for an ETF strategy. Maybe a future post. Here is the future post, Trend-Following Plus Momentum in ETFs.
Backtesting platform used: AmiBroker. Data provider: Norgate Data (referral link)
Good quant trading,

Fill in for free spreadsheet:
