
- in ETFs , Research , Trend Following by Cesar Alvarez
Trend-Following Plus Momentum in ETFs
In a previous post, Trend-following vs. Momentum in ETFs, I compared trend-following and momentum to see which produced better results on a basket of ETFs. In the post, I mentioned combining trend-following and momentum into one strategy to see if combined they can beat buy and hold more often.
Testing Info
Dates: 1/1/2006 to 10/31/2019
The basket of EYFs is AGG, DBC, EEM, EFA, GLD, HYG, IWM, LQD, QQQ, SPY, TLT and VNQ.
Trend-Following Buy Rule
- Close is greater than the 10-month moving average
Momentum Buy Rule
- The 10-month return is greater than zero
Combined Buy Rules
- Last day of month
- If both rules are true, invest 100%
- If only one rule is true, invest 50%
- Buy on open of next day
Sell Rule
- Last day of month
- If both rules are false then exit
- If there is a change in position size, scale to that size
- Sell on open of next day
Using this method, the strategy becomes more invested the more confident it is in the market. At least that is the theory.
Comparing
I will be using the same comparison method as in the Trend-following vs. Momentum in ETFs post.
The metrics I will be using are
Compounded Annual Rate (CAR): Annual growth rate of portfolio. The higher the better
Risk Adjusted Return (RAR): CAR divided by Exposure %. The higher the better
Max. system % drawdown (MDD): The largest peak to valley percentage decline experienced in portfolio equity. The lower the better.
Ulcer Index (UI): Square root of sum of squared drawdowns divided by number of bars. The lower the better.
Sharpe Ratio (SR): The ratio is the average return earned in excess of the risk-free rate per unit of volatility or total risk. The higher the better.
When comparing two methods, each metric will be compared and if it exceeds by 15% then it gets one point. Why 15%? At 10% difference, I consider this noise. At 20%, I believe it is better. So I split the difference.
If the method gets 3 or more points, I will consider it better.
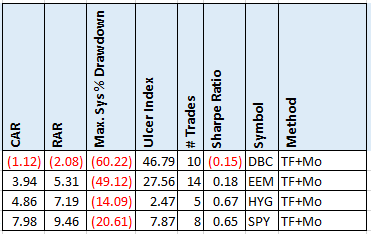
SPY Results
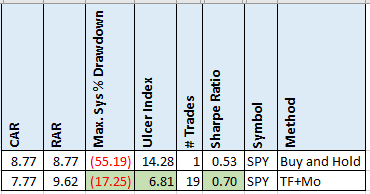
Here we have three of the metrics beat buy and hold. Even the CAR and RAR values are good for the combined method. This is probably the ETF that this idea has most been tested on so I would expect good results here.
Best ETF
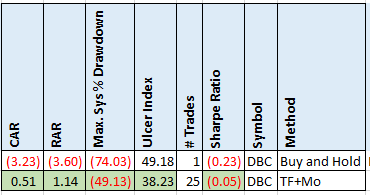
Only one ETF, DBC, beat buy and hold on all metrics. I was surprised that it was this ETF.
The CAR and MDD still suck though but at least they are not as bad as buy and hold.
Worst ETFs
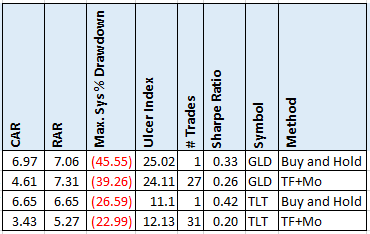
Two ETFs, GLD & TLT, did not beat buy and hold on any metrics.
Which one beat buy and hold?
Overall, only 5 (DBC, EEM, EFA, HYG, SPY) out of 12 ETFs beat buy and hold on three or more metrics.
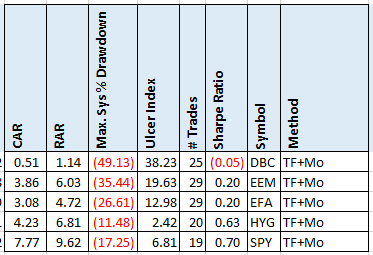
Not very good.
100% Investing
What if on either a trend-following or momentum buy signal, we invest 100%?
Now 4 (DBC, EEM, HYG, SPY) out of 12 ETFs beat buy and hold on three or more metrics. I was expecting better results on this test.
Spreadsheet
Fill in the form below to get the spreadsheet with lots of additional information. See the results of all variations from the optimization run. This includes top drawdowns, trade statistics and more.
Results included different lookback periods (2 to 12) and investing (50,75,100) on a signal but never going on margin.
Final Thoughts
One thing to remember of these results is the small number of trades.
I was expecting much better results with this idea. I thought that there would be more beating buy and hold. From my previous post, trading just momentum beat buy and hold 7 times. While only 5 beat using the combined strategy.
Your results may vary if you use different metrics.
Backtesting platform used: AmiBroker. Data provider: Norgate Data (referral link)
Good quant trading,

Fill in for free spreadsheet:
