
- in ETFs , Market Timing , Research by Cesar Alvarez
Market Timing with a Canary, Gold, Copper, LQD, IEF and much more
One commonality in my strategies is the inclusion of a market timing component. This could be a signal to go into cash or reduce position size or enter a ‘safe’ ETF. This applies to my swing trading strategies, my monthly rotation strategies and my Tactical Assert Allocation strategies. As a researcher, I am always on a looking to improve this part of my strategies.
There have been a handful of market timing methods I have been wanting to test and compare with my current 200-day moving average version. I collected enough of them to test all at once and to compare the results.
The Test
The backtest is from 1/1/2004 to 12/31/2018 on the SPY, dividends included. I start in 2004 because that is as far back as I have data for two symbols that I need. For today’s post, I will focus on only looking at the signal at the end of the month. The reason for this is that both my rotation and TAA strategies trade like this and this might help the most there. In a future post I will look at the effects of trading on a different day of the month.
Buy Rule
- Last trading day of the month
- Market timing gives a buy signal
- Enter on next Open
Sell Rule
- Last trading day of the month
- Market timing gives a sell signal
- Exit on next Open
Nothing complicated. While not in the SPY we will be in cash earning no interest. Improving the cash portion will be a topic of a future post
The Strategies
200-day Moving Average
This is the most common one we have all read
- Buy signal: Close is above the 200-day moving average
- Sell signal: Close is below the 200-day moving average
200-day Moving Average 5 days
This is my current favorite. Will it change after this post?
- Buy signal: Close is above the 200-day moving average for 5+ days
- Sell signal: Close is below the 200-day moving average for 5+ days
1% Band
I developed this one years ago while working for Larry Connors.
- Buy signal: Close is 1% or more above the 200-day moving average
- Sell signal: Close is 1% or more below the 200-day moving average
Golden Cross
I had to include this popular one.
- Buy signal: 50-day moving average is above the 200-day moving average
- Sell signal: 50-day moving average is below the 200-day moving average
Jay Coppock
With a post titled, The Only Indicator You Will Ever Need(?), I had to test it. For more details read the post.
Coppock Guide = The sum of a 14-month rate of change and 11-month rate of change, smoothed by a 10-period weighted moving average
- Buy signal: Coppock Guide closes this month above its level of 3 months ago
- Sell signal: Coppock Guide closes this month below its level of 3 months ago
13-Week High/Low
From my Hi-Lo Index as a Market Timing Indicator post. That was on stocks but I must try this on the SPY.
hiloValue = 40-day moving average of 100*(# stocks making 13-week highs-# stocks making 13 week low)/500
- Buy signal: hiloValue greater than 5
- Sell signal: hiloValue less than 5
LQD/IEF Ratio
From Adam Robinson on the The Knowledge project podcas, a non-stock market podcast, he makes an offhand remark about the ratio of LQD (Investment Grade Corporate Bond ETF) divided by IEF (7-10 Year Treasury Bond ETF) being am good market timing indicator. He gave little details.
I had to play around a little with this given the lack of details
Ratio = LQD close divided by IEF close
- Buy signal: ratio closes above the 200-day exponential average for 5+ days
- Sell signal: ratio closes below the 200-day exponential average for 5+ days
Canary
This idea gave from Trend Following on Steroids post. For both BND (Total Bond Market ETF) and VWO (FTSE Emerging Markets ETF), calculate their momentum. From the post:
So far so good. But how do we identify the right canary assets? Well, we refer to our prior work for details, but in short, we searched for the best canary universe over the in-sample period from Dec 1926 – Dec 1970. We found a two-asset universe consisting of the US Aggregate Bond and Emerging Markets as the optimal canary universe to identify the trend of SPY in the next month. In the following, we will use two Vanguard ETFs — BND and VWO — to represent both assets.
What is the intuition for using BND and VWO as a canary universe? One hypothesis is that SPY is sensitive to yields (higher yields leading to lower SP), and a similar mechanism may hold for US currency (higher USD leading to lower SPY). And higher yields/USD are reflected in lower BND/VWO prices, resp. In addition, VWO may also signal emerging market unrest. Regardless, what matters is the out of sample results of the strategy.
Momentum = 12 times 1-month return plus 4 times 3-month return plus 2 times 6-month return plus 12-month return. Then divide by 4
- Buy signal: momentum for BND & VWO are both above zero
- Sell signal: momentum for one of BND or VWO is below zero
Copper/Gold Ratio
This is from the same podcast of the LQD/IEF Ratio. He commented about using the Copper and Gold ratio. I figured this had no chances on working. The reason he gave is that copper is used in lots of industries when they are doing well, this price goes up. While when the markets are bad, gold goes up.
Ratio = Copper (continuous future contract) close divided by Gold (continuous future contract) close
- Buy signal: ratio closes above the 200-day exponential average for 5+ days
- Sell signal: ratio closes below the 200-day exponential average for 5+ days
How are we going to compare?
I will use these statistics to compare the results
- CAR – Compounded Annual Rate
- MDD – Maximum System Drawdown
- RAR – Risk Adjusted Return. This is CAR divided by exposure.
- SR – Sharpe Ratio
Compounded Annual Rate
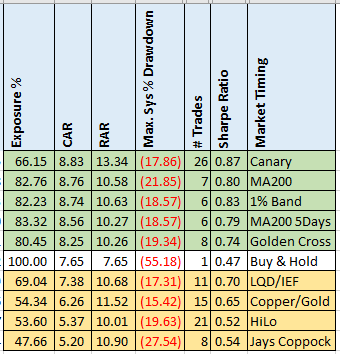
I included Buy and Hold on the SPY as a base comparison. The results fall into two general buckets. Those with CAR between 8.3 and 8.8 and they beat Buy and Hold. Those with CAR below 7.4. The results with CAR above 8.3 are very similar. The Canary method stands out because the high number of trades compared to the other methods. The Copper/Gold did poorly as expected.
Maximum System Drawdown
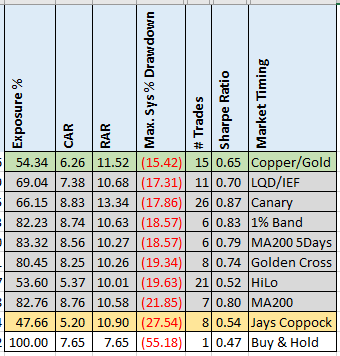
Ranking by drawdowns, I see three buckets. Now Copper/Gold has the best but this is probably partly due to the low exposure. Ranking this way, I like the LQD/IEF method. But the results in the middle buckets are all similar.
Risk Adjusted Return
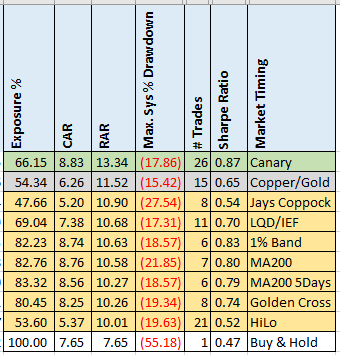
Ranking by RAR, I see three buckets. Again, Canary method stands out. Interestingly Copper/Gold is near the top. Jays Coppock which had been in the bottom using the other two ranking methods moved near the top but the drawdown is by far the worst.
Sharpe Ratio
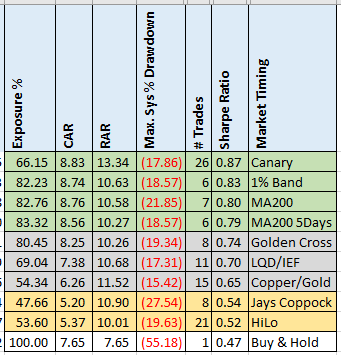
Our final ranking by Sharpe Ratio produces three buckets. The Canary method again at the top.
Potential Issues
The main problem with most market timing methods is the number of trades. The methods had between 6 and 26 trades which is not very much to decide how valid they are. Now I could test further back with most of the methods, but to me the farther you go back the more the markets differ from today. Even if I double the lookback and the trades doubled, it still would not be a lot.
Spreadsheet
File the form below to get the spreadsheet with lots of additional information. This includes top drawdowns, trade statistics and more.
Final Rankings & Thoughts
Taking the raking for each method for each statistic, I then add them up to see which ranked best overall.
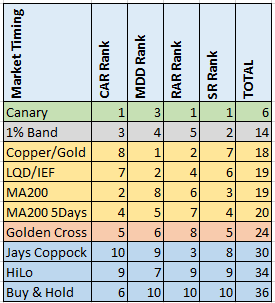
The Canary, Copper Gold and the LQD/IEF methods are near the top of the rankings. These are not direct measures of the market which is interesting. I must spend more time with them to see if I want to incorporate them into my trading.
The MA200, MA200-5Days and 1% Band fell in the middle of the results. This is good to see for me since I use the MA200 and MA200-5Days.
The Golden Cross did worse than I expected.
Jays Coppock and HiLo consistently did not do well.
Buy and Hold fell at the bottom for most rankings. And this is why I use market timing methods.
What are your thoughts on these? Any favorites? Add to the comments below.
Follow on posts: Day of Month and Market Timing and Market Timing and Bond ETFs
Is your trading idea profitable?
Want to backtest your trading idea? Want your strategy evaluated? Contact me for a fixed bid on your project. 100% confidential.
Backtesting platform used: AmiBroker. Data provider: Norgate Data (referral link)
Good quant trading,

Fill in for free spreadsheet:
