
- in ETFs , Market Timing by Cesar Alvarez
Day of Month and Market Timing
In my previous post, Market Timing with a Canary, Gold, Copper, LQD, IEF and much more, I tested several market timing methods. The signal was checked on the last day of the month. Now the question is what happens if we check on a different day? How different will the results be?
The Test
The backtest is from 1/1/2004 to 12/31/2018 on the SPY, dividends included.
Buy Rule
- On N days before the end of the month.
- Market timing gives a buy signal
- Enter on next Open
Sell Rule
- On N days before the end of the month.
- Market timing gives a sell signal
- Exit on next Open
For N, I tested values from -8 to 8. A negative number is days before the end of the month. A -1, means on the second to last day of the month. A zero is the last day of the month. A 3, is the third trading day of the month.
Compounded Annual Rate
First, let’s compare the average return for all the days to the end-of-month (EOM) value.
CAR: Average vs End-of-Month
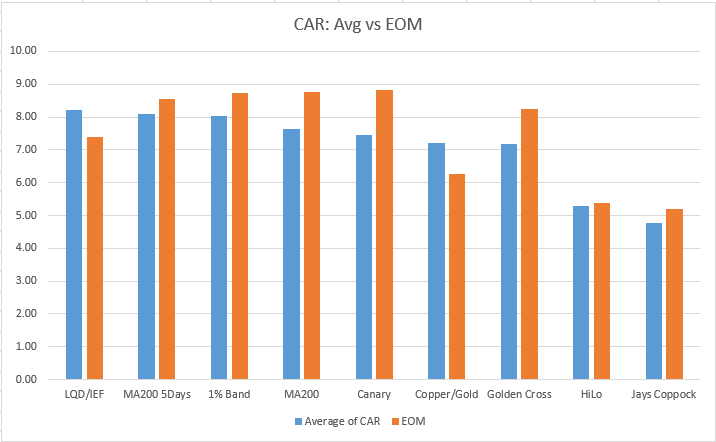
For most strategies, the average value is smaller except for Copper/Gold and LQD/IEF. The best EOM strategy, Canary, drops to 5th place. Not a good sign for Canary. Is that the canary in the coal mine for the Canary Method?
Highest CAR minus the Lowest CAR
Next, we look at the Highest CAR minus the Lowest CAR to see how big the range is.
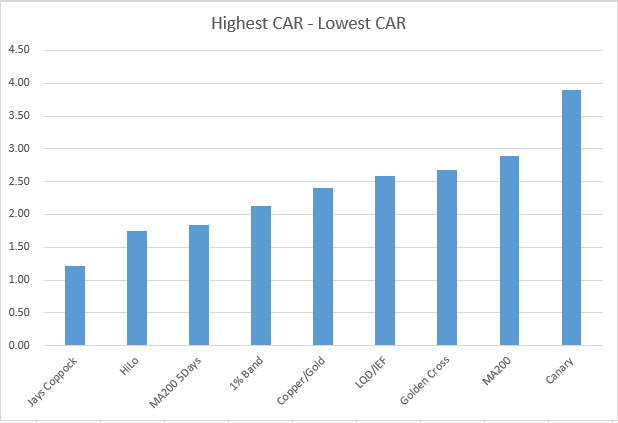
No surprise seeing Jays Coppock and HiLo with the smallest range since they have the smallest average CAR under 6%. Of those with average CAR above 7%, my current favorite MA200 5 days has the smallest range. The Canary method with the best EOM month CAR also has the biggest range between the highest and lowest CAR.
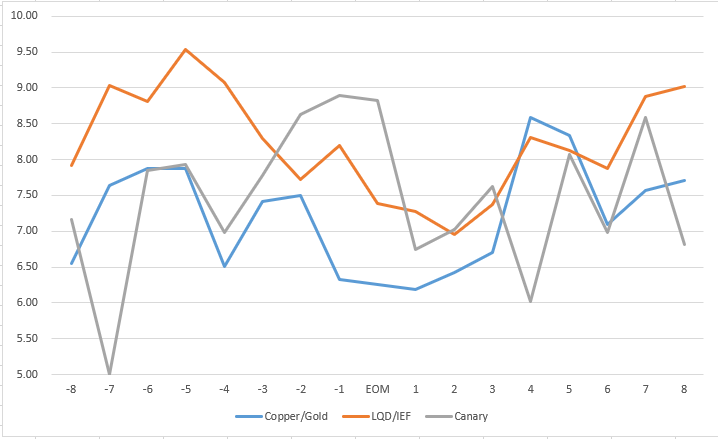
Day of Month: Non-Price
Here we have the day breakdown for the three methods not using the SPY close. Interesting that the LQD/IEF method has the worst results near the EOM. While the Copper/Gold fluctuates through out the month.
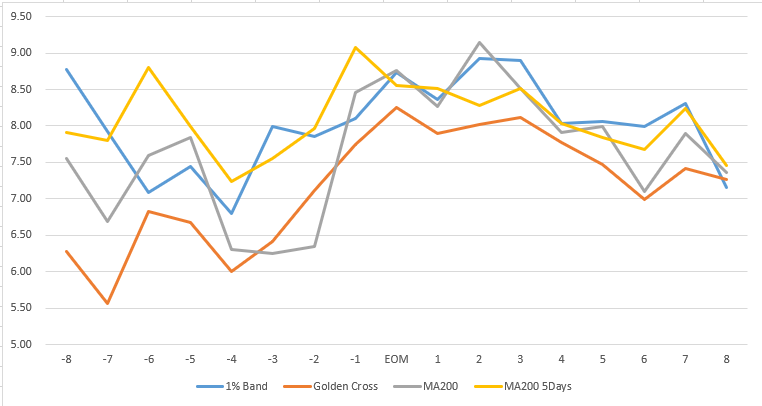
Day of Month: Price
Here we have the day breakdown for four methods using the SPY close. Most of these method do better the first days of the month vs near the end of the month.
Maximum System Drawdown
How do the maximum system drawdown numbers compare?
MDD: Average vs End-of-Month
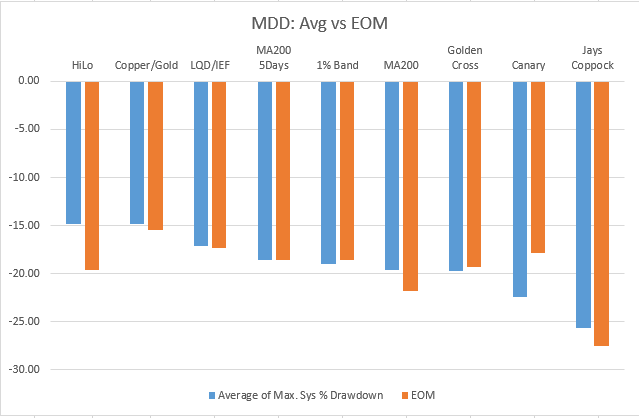
Interestingly the average number is typically better. The only real exception being the Canary method, where the EOM is 4.6 points worse.
Highest MDD minus the Lowest MDD
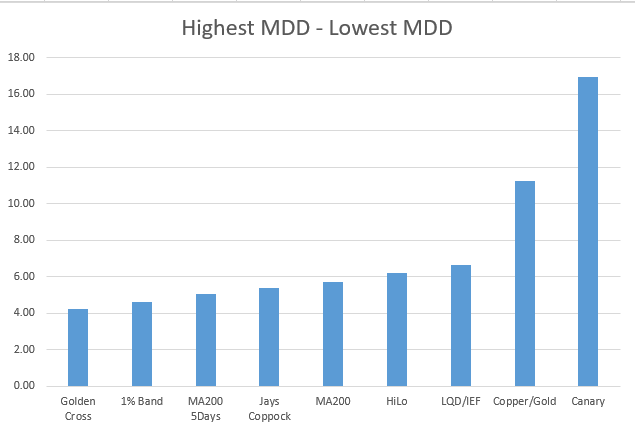
Comparing the range of the MDD across the month we can see most are not that big. Except for the Copper/Gold and Canary which show a large range between the best and worst. Not something I like to see.
Day of Month: Non-Price
Here we have the day breakdown for the three methods not using the SPY close. LQD/IEF has a nice tight range.
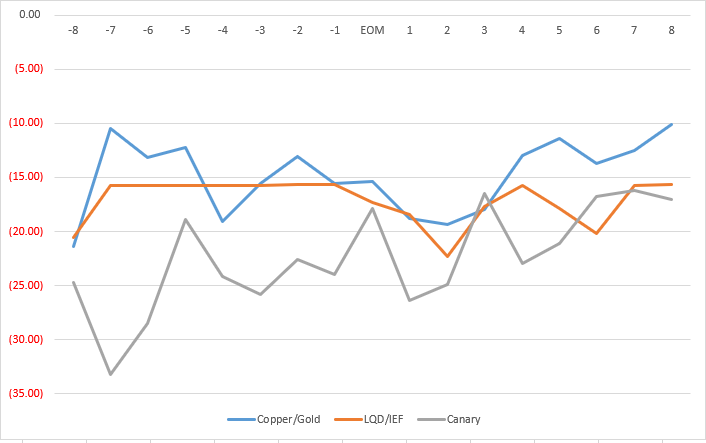
The LQD/IEF method is consistent. As to the other two, I don’t like the wide range.
Day of Month: Price
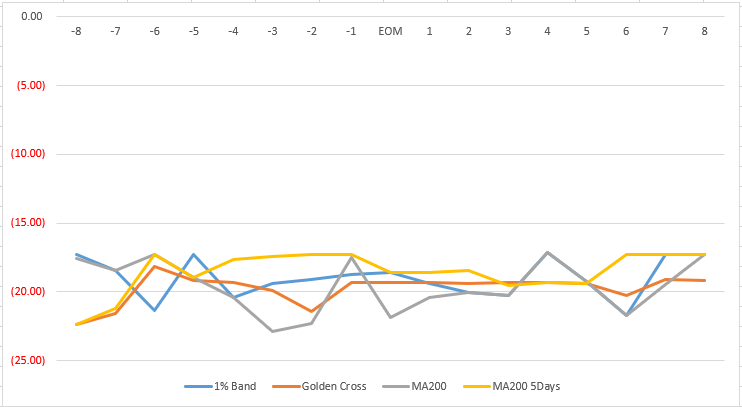
These priced based methods all have a nice tight range. Good to see.
Sharpe Ratio
I almost decided not to look into this because I did not expect to see much because of the size of number we are working with. So here are the charts.
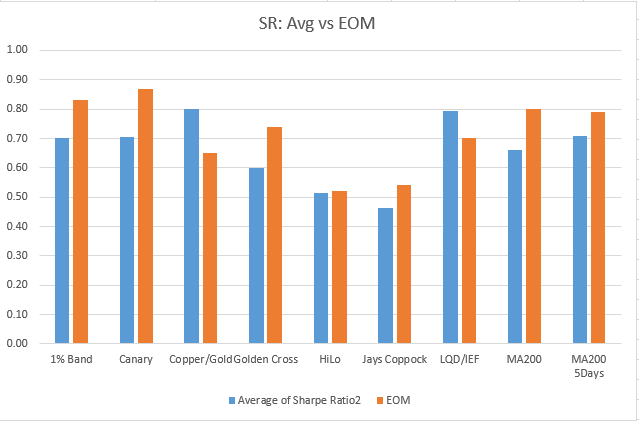
SR: Average vs End-of-Month
Nothing surprising here. The EOM numbers are better than the average most of the time.
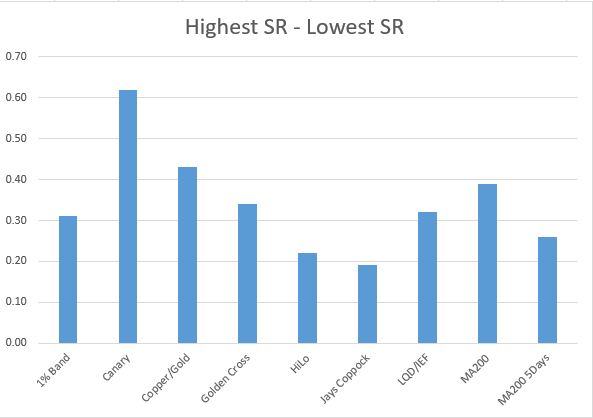
Highest SR minus the Lowest SR
This is where I had to recheck my numbers. I was not expecting such a huge difference. Look at the Canary which has a difference of .62 between the best and worst Sharpe Ratio. Now I want to see the DOM breakdown.
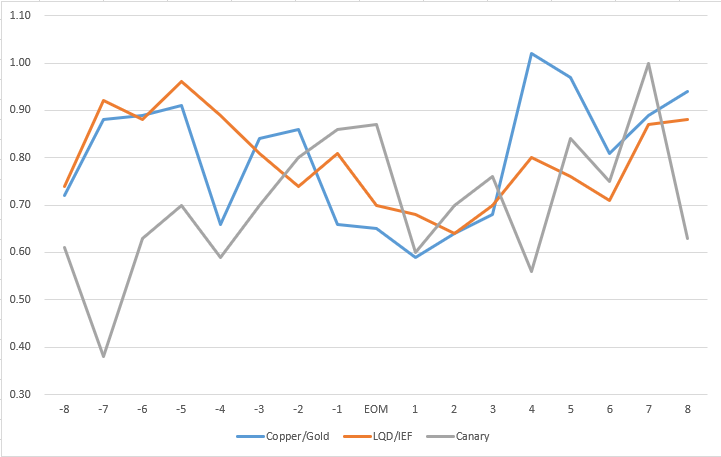
Day of Month: Non-Price
Wow, look at the variability in Canary. From a low of .38 to a high of 1.0 for Sharpe Ratio. Copper/Gold has a high of 1.02.
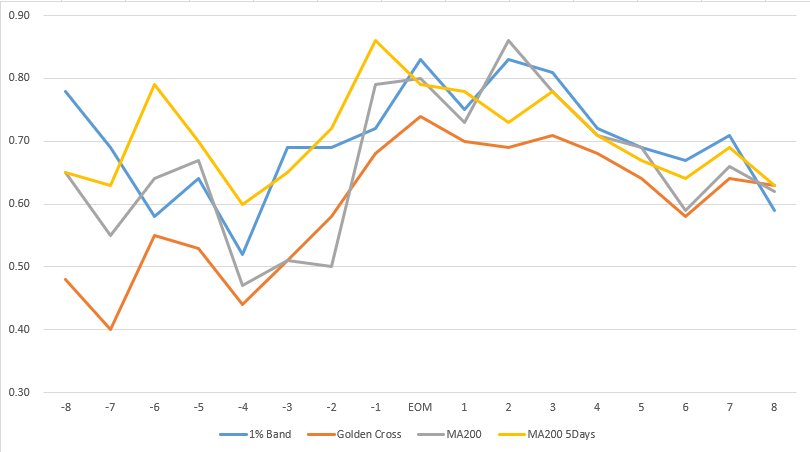
Day of Month: Price
The variability here is not as big but still there. For those of you that like Sharpe Ratio, this is something to watch out for.
Any Day Rotation
Now comes the next obvious question from you traders out there. You follow the market every day and want to trade when the signal comes in. Not wait for some arbitrary day in the month. Here are the results when you remove the day of the month restriction.
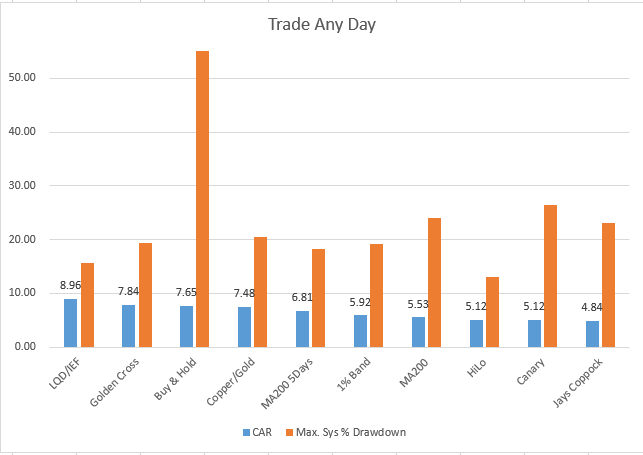
Only LQD/IEF and Golden Cross beat Buy and Hold on a CAR basis. But Copper/Bold and MA200-5Day came close with much smaller drawdowns.
Spreadsheet
File the form below to get the spreadsheet with lots of additional information. See the results of all variations. This includes top drawdowns, trade statistics, yearly returns and more.
Final Thoughts
As expected, the statistics fluctuate depending on when you trade. But some strategies had huge variations. The Canary method which did so well trading on the EOM, had a huge variation in CAR and Sharpe Ratio. The Canary method may be too sensitive and need a rule like the having a buy signal for 5 days before entering and a sell signal for 5 days before exiting.
Most of the other methods held up well.
This is another lesson on the importance of parameter sensitivity and setting expectations for your strategy.
Follow on posts: Market Timing and Bond ETFs
Backtesting platform used: AmiBroker. Data provider: Norgate Data (referral link)
Good quant trading,

Fill in for free spreadsheet:

