
- in Research , Rotation , Stocks by Cesar Alvarez
Backtesting a Dividend Strategy
I was recently at a NWTTA presentation about the “S&P 500 Dividend Aristocrats” and how to trade these stocks. The strategy was part quantitative and part discretionary. It was popular talk with lots of good questions. People always seem interested in dividend stocks but for me they are just another stock with another reason to go up or down. I don’t like to dismiss ideas without testing. The strategy relies on fundamental data that I do not have access to but I have dividend data from Norgate Data. Would that be enough to create a strategy worth trading?
S&P 500 Dividend Aristocrats
Here is the definition of this index from S&P Dow Jones site
S&P 500® Dividend Aristocrats® measure the performance of S&P 500 companies that have increased dividends every year for the last 25 consecutive years. The Index treats each constituent as a distinct investment opportunity without regard to its size by equally weighting each company.
You can get a current list of the Aristocrats at Wikipedia
Of course, there is an ETF, NOBL, that follows this index. This has only been trading since October 9, 2013 with an even better explanation of the index.
The S&P 500® Dividend Aristocrats® Index, constructed and maintained by S&P Dow Jones Indices LLC, targets companies that are currently members of the S&P 500®, have increased dividend payments each year for at least 25 years, and meet certain market capitalization and liquidity requirements. The index contains a minimum of 40 stocks, which are equally weighted, and no single sector is allowed to comprise more than 30% of the index weight. The index is rebalanced each January, April, July and October, with an annual reconstitution during the January rebalance.
Can I make my own dividend strategy that outperforms the index and ETF?
Base Version
Given my data constraints, the strategy will be loosely based on the Aristocrats strategy. My data starts in 1990 and I want to start the test in 2007. That leaves 16 up dividend years at most that I can test. I will not be limiting the stocks in a sector because I do not have historical data for this. I will only hold 10 positions at time vs the 50 because less positions tends to yield higher returns.
Test date range: 1/1/2007 to 8/31/2018
Buy Rules
- It is the last trading day of the year
- Stock is a member of the S&P500 index
- Stock has had increasing dividends for 16 years or more
Ranking formula = 1000*(# of years of rising dividends) +(6-month return). This gives us preference to stocks with the longest dividend raising history with the tie breaker being the 6 month return.
Buy on the next open
Sell Rules
- If stock is removed from the index during the year, sell the next day
- At end of year sell all positions
Sell on the next open
Base Results
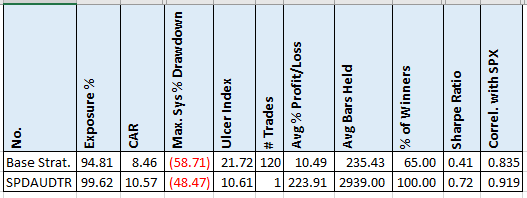
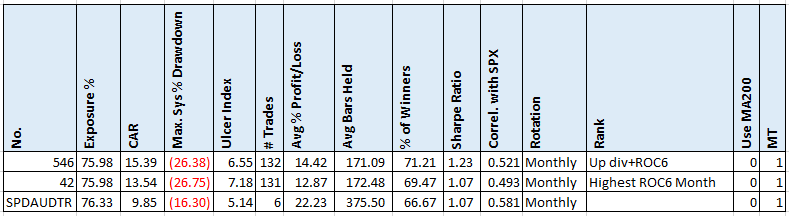
My data provider has the Aristocrats total return index, SPDAUDTR, which I will compare against.
Well this start does not look too promising. On all metrics, my version does worse than the index.
Other Ranking Methods
What about other ranking methods? I tried the following:
- Lowest 100-day historical volatility
- Highest 100-day historical volatility
- Highest 12-month return
- Highest 6-month return
- Highest 12-month Sharpe Ratio
- Highest 6-month Sharpe Ratio
- (# of dividend up years) *1000 + 6-month Sharpe Ratio
- Highest above 200 day moving average
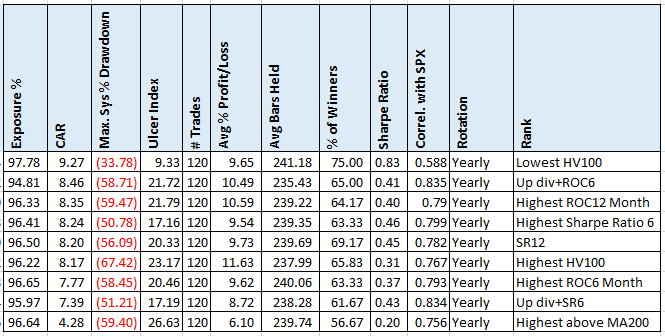
A couple of stats to notice. For the most part CAR & MDD changed little. The lowest HV100 ranking did substantially reduce MDD. Ranking by distance above MA200 greatly reduced CAR. But still results are not better than index.
Monthly & MA200
Does requiring that the stock be above its 200-day moving average before purchase help? What if at the end of each month, we check if the stock is below the 200-day moving average. If it is, then sell it and look for a new position?
Rule Changes from Base
Buy
- Stock must be above MA200
- Set up now at end of each month
Sell
- If at end of month, stock is under MA200
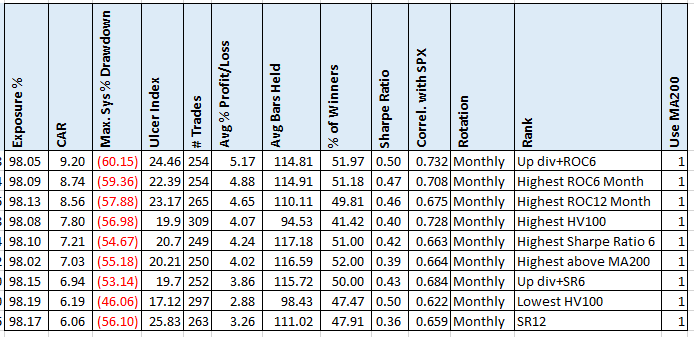
Surprisingly no real change in the numbers. On to my next favorite idea.
Monthly & Market Timing
If you look at the first table, you will notice that the index has a .92 correlation with the SPX. That is huge. What about adding my favorite marketing timing indicator that the SPX must be above the MA200?
Rule Changes from Base
Buy
- SPX must be above MA200
- Set up now at end of each month
Sell
- If at end of month, SPX is under MA200. Sell everything
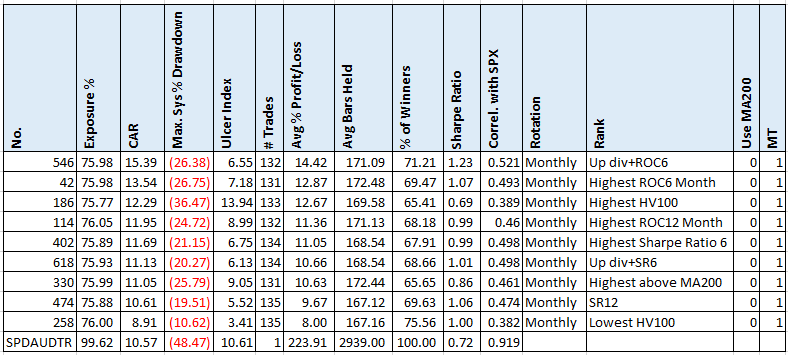
Now we are getting somewhere. We have increased CAR by 50% and dropped MDD by 50%. But is it worth the work?
Market Timing on Index
What if we traded the index monthly with a 200-day MA on the SPX filter.
Wow, look at the reduction on MDD for the trading the index with only a small drop in CAR.
Issues
There are lots of ways to poke holes at this test. I only have data back to 1990 and that limits the test at the start to 16 up years of dividends. A bigger issue is what if we enter a stock on January 2nd and then on January 3rd it announced that it is cuttings its dividend. In theory we could be in the stock for the entire year. Without news data, there is nothing one can do about this. In theory, one could look at the dividend history and then try to calculate when or if a dividend was cut. I started down this path but it was a total pain.
The strategy only invests in 10 stocks vs 40 for the Aristocrats. My reason for only 10 was that I wanted to beat the index and normally that means concentrating your portfolio. The spreadsheet has results for a 20-stock portfolio.
I did not limit the number of stocks per sector. What little testing in the past I have done with points to it helps drawdowns at the expense of returns.
Spreadsheet
Fill in the form below to get the spreadsheet with lots data. This includes yearly returns, top 5 drawdowns, top 5 draw lengths, (6,8,10,12,14,16) up dividend years, rotation (monthly, quarterly, yearly) and (10,20) maximum positions.
Final Thoughts
Would I trade this. Probably not. I did not find the performance that much better than the index to warrant the work.
A reason I hear to trade dividend stocks is that they are “protected” on the downside because of the dividend. As price goes down, the dividend percent goes up. But my view on this is that the dividend is another reason for the stock to go down. And go down fast. If a company that has raised dividends for 10+ years announces that they are not, you can bet the stock will go down. Imagine if they announce that they are stopping the dividend.
In early 2020, Norgate Data added the S&P 500 Dividend Aristocrats to their data. Read S&P 500 Dividend Aristocrats to see how these tests did on this new data.
Backtesting platform used: AmiBroker. Data provider: Norgate Data (referral link)
Good quant trading,

Fill in for free spreadsheet:
