
- in Research , Rotation , Stocks by Cesar Alvarez
Inverse Volatility Position Sizing
Recently I’ve had several of my consulting clients come with a strategy that uses Inverse Volatility Position Sizing. The basic idea is that the more volatile positions have smaller size while the less volatile ones get a larger size. I have always been a fan of equal position sizing for several reasons. One, it is simple to do. Two, it is one less variable to optimize on and thus overfit on. Three, I rarely see much change in the metrics I care about when using more sophisticated algorithms.
Inverse Volatility Position Sizing is said to slightly reduce returns but has a big decrease in drawdowns and an increase in Sharpe Ratio. Time to test and see if that is true.
Recently I wrote about a monthly rotation strategy. I will be using that as a base to compare against.
Inverse Volatility Position Sizing Calculation
As a measure of volatility I will be using historical volatility.
- Calculate the historical volatility for each stock to get HV
- Take the inverse of the HV to get INV_HV. This means INV_HV = 1/ HV
- Sum all the INV_HV for the stocks to get TOTAL_IHV
- Position size for a stock is its INV_HV/TOTAL_IHV
Example
Three stocks in our EXPE, MSFT, NFLX. We will be using 100-day Historical Volatility
Step 1 – Calculate HV
EXPE HV100 = 55
MSFT HV100 = 19
NFLX HV100 = 32
Step 2 – Invert
EXPE INV_HV = 1/55 = .0182
MSFT INV_HV = 1/19 = .0526
NFLX INV_HV = 1/32 = .0313
Step 3- Sum INV_HV
TOTAL_IHV = .0182 + .0526 + .0313 = .1021
Step 4 – Calculate Position Size
Position Size for EXPE = INV_HV/TOTAL_IHV = .0182 / .1021 = 18%
Position Size for MSFT = .0526 / .1021 = 52%
Position Size for NFLX = .0313 / .1021 = 31%
With this example, we run into one issue I have with this sizing method. Look at the position size of MSFT vs EXPE. It is 3 times bigger.
The Rules
Test date range 1/1/2007 to 11/30/2019.
Buy Rules
- It is the last day of the month
- Stock is a member of the Nasdaq 100. I test several others.
- Close is above the 200-day moving average
- The close of the $SPX is above the 200-day moving average
- Buy the top 5 highest priced stocks on the next open
The price I am using is the as traded price. This is the price before it has been adjusted for splits and dividends. This is the price you would have seen on your screen at the end of the day.
Sizing: Equal position sizing (EPS). Inverse volatility sizing (IVS) using [5, 10, 15, 20, 25, 50, 100, 125, 175, 200] day historical volatility.
Sell Rules
- It is the last day of the month
- Sell on the next open
The Metrics
Since the general claim is that risk is reduced, I will be focusing on Maximum Drawdown, Ulcer Index and Sharpe Ratio. But keeping an eye on Compounded Annual Growth Rate.
Nasdaq 100 Results
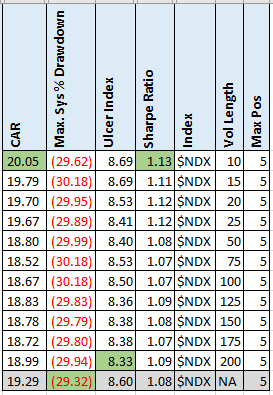
The grey row is EPS. Green cells are the best for that metric. The change in results from EPS and IVS are small. EPS had the best drawdown. The Sharpe Ratio improved by 5%, which is noise in my book. I am not seeing any real improvement in the risk numbers for the extra work.
Russell 3000 Results
Maybe a different index would produce different results
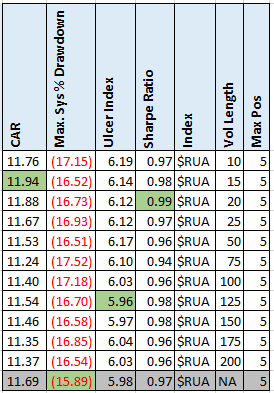
Again, seeing very little change in the results. Drawdown is better with EPS. With IVS, Ulcer Index is unchanged and Sharpe Ratio is 2% better. Again, the difference in the results is noise.
Spreadsheet
Fill in the form below to get the spreadsheet with lots of additional information. Included are results for Russell 1000 index and for a maximum positions of 10. See the results of all variations from the optimization run. This includes top drawdowns, trade statistics and more.
Final Thoughts
These results are what I have generally seen in my other tests. Maybe small improvements in the risk metrics but they are often less than 5% better. Is it worth all the extra work? I don’t like that this gives even more variables to potentially overfit the data with. In this example, two, the chosen volatility formula and the length of the lookback.
Another reason I do not like IVS is that even low volatility stocks can quickly crash. Meaning this sizing can get you into a large position in a low volatility stock that then crashes overnight.
Maybe a month Is not enough time for Inverse Volatility Sizing to show its benefits? Maybe a better measure of volatility would help.
Maybe IVS works well with your strategy. As I like to say “test everything.” Share your thoughts below.
Backtesting platform used: AmiBroker. Data provider: Norgate Data (referral link)
Good quant trading,

Fill in for free spreadsheet:
