
- in Research by Cesar Alvarez
RSI2 (Relative Strength Index) Indicator Analysis
From my time with working with Larry Connors, I have become known for using the 2-Period RSI (RSI2) (Relative Strength Index) in my trading. I have written lots of blog posts that use it and I often use it in my personal strategies. One thing I like to do with indicators that I use frequently is a thorough analysis of them. Often, I find characteristics that I did not expect. Do you know about the RSI2 smile?
Data
The universe analyzed.
- Dates: 1/1/2007 to 12/31/2017
- Russell 3000 (includes delisted stocks and as index existed)
- 21-day moving average of dollar volume greater than $1 million
- As traded price greater than $1
- Trading for more than 100 days
On every day I collected the following stats.
- RSI2, RSi3 RSI4 values
- 100-day historical volatility
This gave me 6.9 million data points. Some random stats from the data.
- The average RSI2 of all these is 51.6
- There were 9,456 RSI2 readings of less than .1
- There were 14,789 RSI2 readings of greater than 99.9
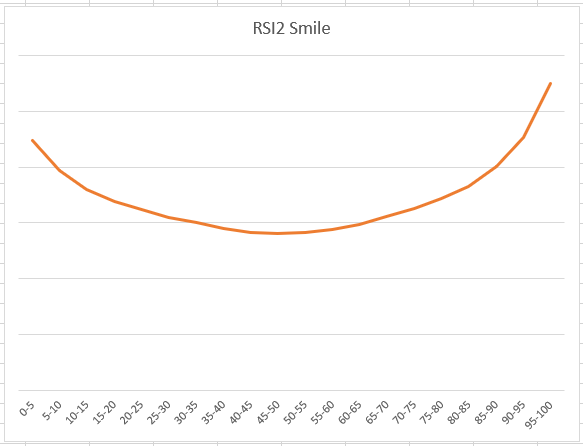
The RSI2 Smile
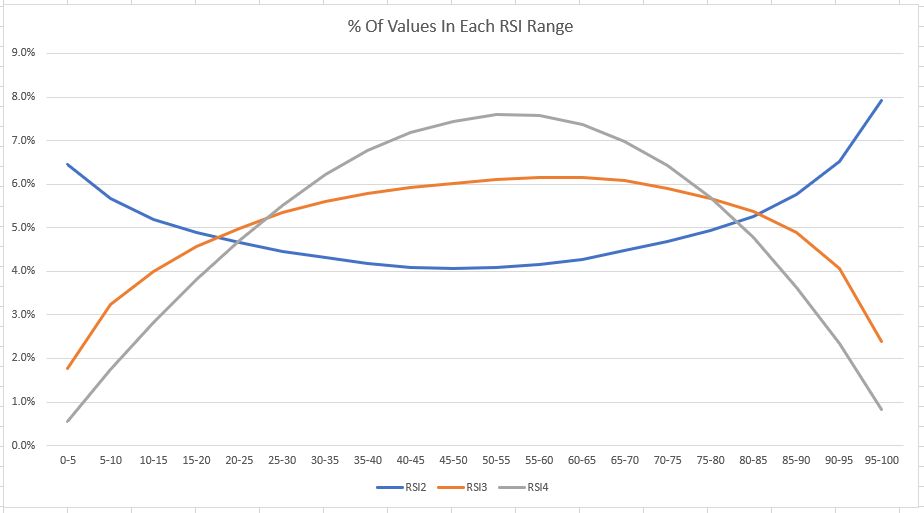
The first view of the data is what percent of all the values are in each RSI bucket. I divided the range into 20 buckets of 5 RSI points each. Most people expect the low and high RSI values to be less common. Which is true for all lengths greater than 2. But for 2 day, you get the RSI smile, the blue line.
Down Days
Another interesting characteristic of RSI of any length. If the RSI has been down for N days in a row, that means the stock has closed down for N days in a row. I remember a test I did in 2004 where one rule was that the RSI2 had closed down 3 days in a row. I then added the rule that the stock had also closed down 3 days in a row, thinking this would be a confirming rule to the sell off and thus reduce the number of trades. But the number of trades did not change. After spending time investigating the RSI formula and running tests, I realized that RSI was already capturing this. Also, if the RSI2 is unchanged for the day, the stock then closed unchanged for the day
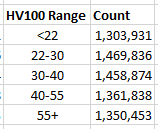
Volatility Buckets
A common thing I hear is that high volatility stocks are more likely to have very low or very high RSI2 readings. Using the 100-day historical volatility, I divided the 6.9 million data points into 5 HV buckets of the same approximate size. The cutoffs and values are.
Using those ranges, what does the RSI2 distribution look like?
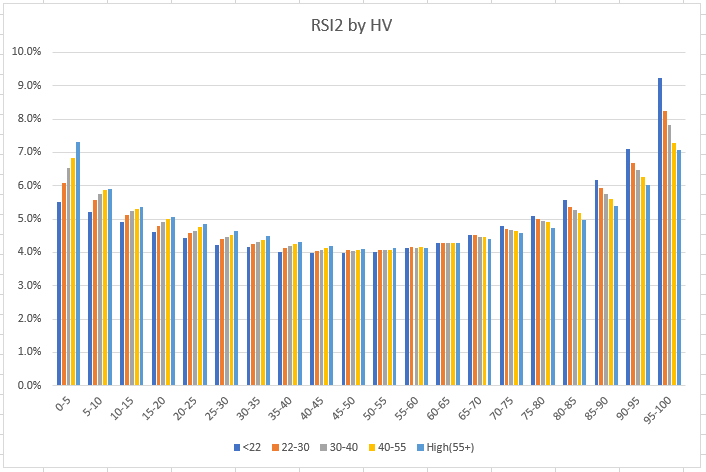
From this we can see the high volatility stocks get to under 5 more often than low volatility stocks. This confirms the low readings for high volatility stocks. But the high readings happen more often for the low volatility stocks. This makes sense because stocks that keep going up tend to do it slow and steady which lowers the volatility.
RSI2 Yearly Totals
Has the number of stocks reaching reading under 10 or over 90 changed over the last 11 years?
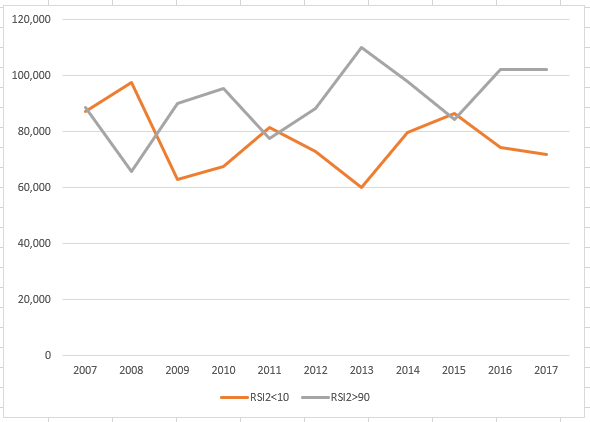
The RSI2>90 seems to trending slightly up while the RSI2<10 is trending down. But this is what I would expect since the market has been in a bull market during most of this time. Some years change more than 30% from the previous year’s totals. This is much bigger than I expected.
But this got me thinking, how correlated is the yearly total to the yearly return of the Russell 3000 index?
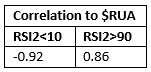
Wow, those numbers are a lot higher than I expected.
Spreadsheet
Fill the form below to get the spreadsheet that has the summary data and more in it..
Final Thoughts
Did you learn anything new about the 2 period Relative Strength Index?
RSI2 smile I have known about for over a decade. The very high correlation to the number of stocks under 10 to the annual return is something I just learned doing this post. Understanding the behavior of an indicator allows me to make better of use of it in my strategies. It also guides me on what other indicators I might use to complement the RSI2.
Backtesting platform used: AmiBroker. Data provider: Norgate Data (referral link)
Good quant trading,

Fill in for free spreadsheet:
