
- in ETFs , Market Timing , Research by Cesar Alvarez
Reducing Whipsaws When Using 200-day Moving Average for Market Timing
I was working on testing a market timing indicator that I read about it. It was showing some promise and the next step was to compare it to my benchmark. My benchmark is using the 200-day moving average. But an additional rule removes a lot of the whipsaws that can happen.
After doing the comparison, the market timing indicator compared well. But then I realized I had not written a blog post about my additions. I touched on it in the Market Timing with a Canary, Gold, Copper, LQD, IEF and much more post.
For me, the goal of using the 200-day MA to trade the SPY is to get about the same CAR but with a significant reduction in MDD.
Rules
Test date range: 1/1/2000 to 6/30/2023
Buy
- Close is above the 200-day moving average for N=[1,2,3,4,5] days in a row
- Buy on the next open
Sell
- Close is below the 200-day moving average for N days in a row. The value used here is the same as used for the buy.
- Sell on the next open
SPY Results
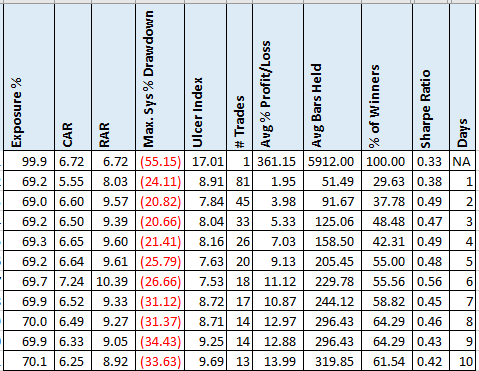
The first row of the results is buy and hold. While the second row, days equal to 1, is the traditional 200-day moving average strategy. As expected, the days=1 greatly reduces the MDD but the CAR drops by about 1.2 points. Using Days of 2, we reduced the number of trades almost in half and now the CAR is only .12 points below buy and hold and the MDD is even better. The values between 3 and 6 all have small reductions in CAR with large reductions in MDD with significantly fewer trades.
QQQ Results
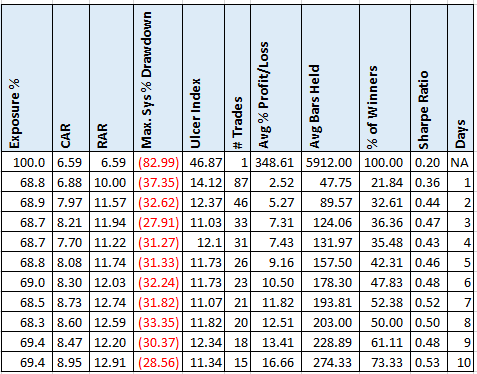
Typically, I only use the 200 day moving average on the SPY but I wanted to see how it would do on the QQQs. I was surprised by these results. For all values between 2 and 10, we have higher CAR, lower MDD and fewer trades.
Spreadsheet
Fill in the form below to get the spreadsheet with lots of more information. See the results of all variations from the optimization run. This includes top drawdowns, trade statistics and more.
Final Thoughts
If you are looking to reduce the whipsaws, using this simple rule does that with no degradation in the original statistics. What value one chooses, is a personal choice on how long you want to wait for confirmation of the trend in the other direction.
These rules can be used either to trade the SPY or as a market regime filter for a strategy. I use them for both. For my trading, I typically use either 3 to 5 days. I find this is a good balance between reducing whipsaws and being too late to enter new trends.
Backtesting platform used: AmiBroker. Data provider: Norgate Data (referral link)
Good quant trading,

Fill in for free spreadsheet:
