
- in Research by Cesar Alvarez
Missing the best or worst market days
This morning I saw the chart on Ritholz.com of what happens when you miss the best X days of the market. I see a variation of this chart often and is used to argue why someone should not try and time the market. One concept I like to do is to invert. Meaning try the opposite idea and see what you get. What I rarely see is the chart if you missed the worst X days. Given it is a rainy Sunday morning here in Seattle and I had nothing better to do, I wanted to see that chart.
The Test
The chart shown was through 2016. I used SP 500 Total Return index data from 1/1/1996 to 9/30/2018. Entry and exit are done at the close. For example, if tomorrow will be a best day, then the test exits at today’s close and enter on the next day’s close.
The argument for why you should not try and time the market
Here is what happens when you miss the best days.
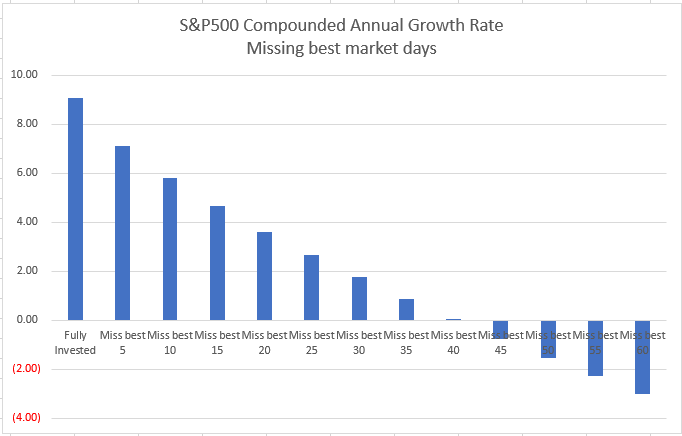
As expected the returns get worse and worse as you miss more days. Missing good days is bad.
The argument for why you should try and time the market
Here is what happens when you miss the worst days.
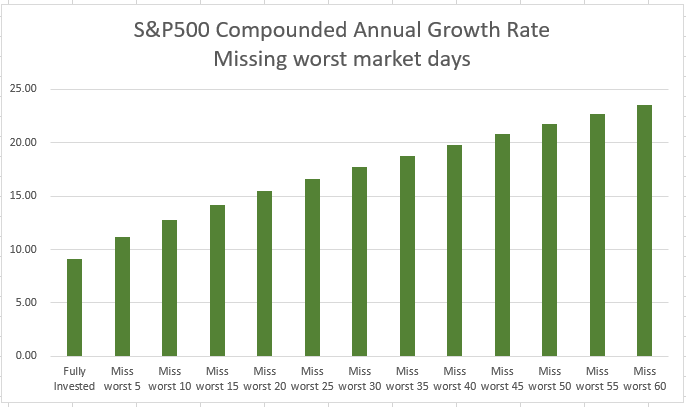
Again, as expected the returns improve. But notice home much they improve. Fully invested CAR is 9.08% vs missing the worst 60 with a CAR of 23.53%.
What about maximum drawdown?
What happens to the drawdown as you miss those worst days?
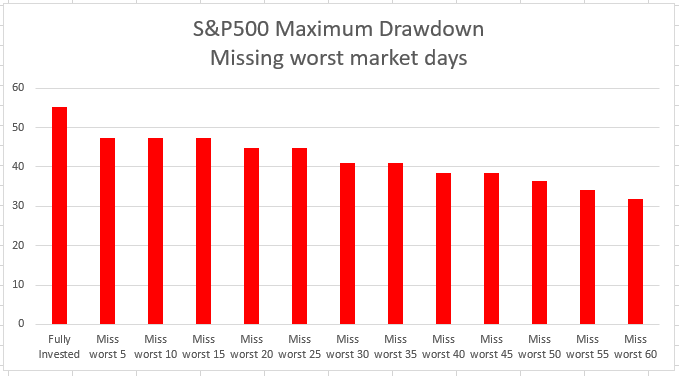
MDD goes from 55.25% to 31.89%.
Spreadsheet
File the form below to get the spreadsheet with lots of additional information. This includes top drawdowns, trade statistics and more.
Final Thoughts
At the end of the day both ideas should be dropped. They show you the obvious. You would be crazy to try and time the market on a day by day basis. These best and worst days also tend to bunch up, which makes it even harder.
Backtesting platform used: AmiBroker. Data provider: Norgate Data (referral link)
Good quant trading,

Fill in for free spreadsheet:

