Category Archives for "Rotation"

The post ETF Sector Rotation generated some good ideas on what to try differently. This post will focus on two ideas on the Select Sector SPDR ETFs. The next post will look at two ideas using Fidelity sector mutual funds.
My recent research has been in ETFs which I have not explored in several years. ETF sector rotation has always intrigued me. The idea seems so simple that it should work. Always be in the sector that has been doing the best. I like simple but does it work? If not, can we make it work?
One area of recent interest for me is trading rotational strategies on a monthly timeframe using S&P500 stocks and ETFs. Areas of exploration include Momentum and Dual Momentum. Recently I came across The Secret to Momentum is the 52-Week High??? on Alpha Architect, a blog I highly recommend on reading along with the quant mashup Quantocracy.. The article is a synopsis of research done comparing momentum vs. 52-week highs as ranking filters for a rotation strategy. A new idea I had not tried. What a great way to start the year, testing a new idea. Even though often they do not work out, one needs to be exploring all the time.
From my post on Heikin-Ashi Charts, another researcher wrote Luck: The Difference Between Hired or Fired about how luck of the draw could account for the difference in returns depending on the starting date. This is a completely valid question. Are three better returns for a strategy in a particular area of the month or is it random? I do believe that luck plays a large part in our trading results, which is a future blog post. But from previous work on 5 day holds, I know that the end of the month and beginning on the month tend to be better times for ETF mean reversion.
The ‘Intermediate Term Stock Rotation Strategy Using S&P500 Stocks’ post generated lots of reader suggestions on what to investigate further.
The ideas we will investigate are:
One of my research goals for this year is to find an intermediate term rotation strategy using S&P500 stocks. Then right on cue, I read the following post Intermediate momentum! which points to research Is momentum really momentum? by Robert Novy-Marx. In that he mentions that “intermediate horizon past performance, measured over the period from 12 to seven months prior, seems to better predict average returns than does recent past performance.” I have never tried an idea like this. In the blog comments, a user says he got great results using the current NDX100 stocks not the historical. This introduces pre-inclusion bias but maybe the results will still be good. What a great way to start the year with ideas I have never tested.
From the “Should You Buy the Best or Worst YTD Stocks” post, several readers made comments if one could make a monthly rotation system from this idea. From that post, buying either the strongest or weakest stocks out-performed the SPX with the weakest giving the best results. Will that be the case again?
Does the percent of S&P500 stocks trading above their 50 day moving average predict future market returns? Over the last several weeks, I have seen several charts of the percent of S&P500 stocks trading above their 50 (or 200) day moving average overlaid on the S&P500. From these charts, it appears one could build a market timing indicator. The concept really looks like it has promise.
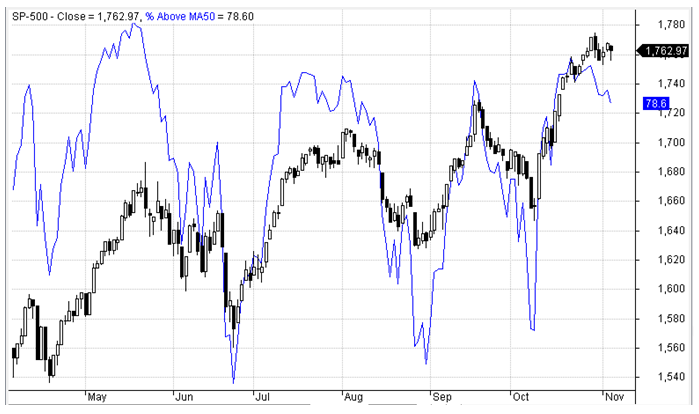
Chart from April to November 2013.
Is it better to buy the worst year-to-date performing stocks or the best year-to-date performing stocks for the month of December? Common wisdom would say stay away from the losers because those are the one that people are selling for tax reasons. Are fund managers buying the winners for window dressing?
In the previous post “Which S&P500 stocks to focus on when the SPX has 5 higher closes,” we discovered which stocks (from the S&P 500) produced the best returns when the market closed higher five consecutive days . The results from that work, as often happens, suggested a deeper look; specifically, can those concepts be applied to S&P 500 stocks without having to wait for specific market conditions (e.g. five up days in the SPX)? If so, maybe this is the start of a viable, standalone trading strategy. As indicated, this post builds on the previous post, so please refer as needed.