
- in ETFs , Mean Reversion , Research , Trend Following by Cesar Alvarez
Mean Reversion vs Trend Following Through the Years
Something I am always thinking about is how the markets are behaving now vs the past few years vs several years ago. My edge on the strategies I trade depends on two main ideas. One, current market behavior is similar to what I tested on which is normally the last 5-10 years. Two, not too many others have found the same edge. Unfortunately for (2), more and more people are trading quant style and edges are harder to find and smaller when I do find them. The only thing I can control is continuing to research for new strategies.
I trade a variety of strategies based on mean reversion, trend following, breakouts and volatility. I have three mean reversion strategies in my trading stable and therefore care very much about how mean reversion is doing.
The Idea
Using SP-500 index data back to inception in 1957, I wanted to compare how the index did 1 & 5 days after either being in an over-sold or over-bought condition. Why back to 1957? I was curious to see how markets behaved then but mostly care about the last 15 years. Why 1 & 5 days? Because that is the typical holding period of my mean reversion strategies.
Test date range: 1/1/1957 to 11/30/2023. Entry and exit occur at the close. No commissions.
2-Period RSI One Day Later
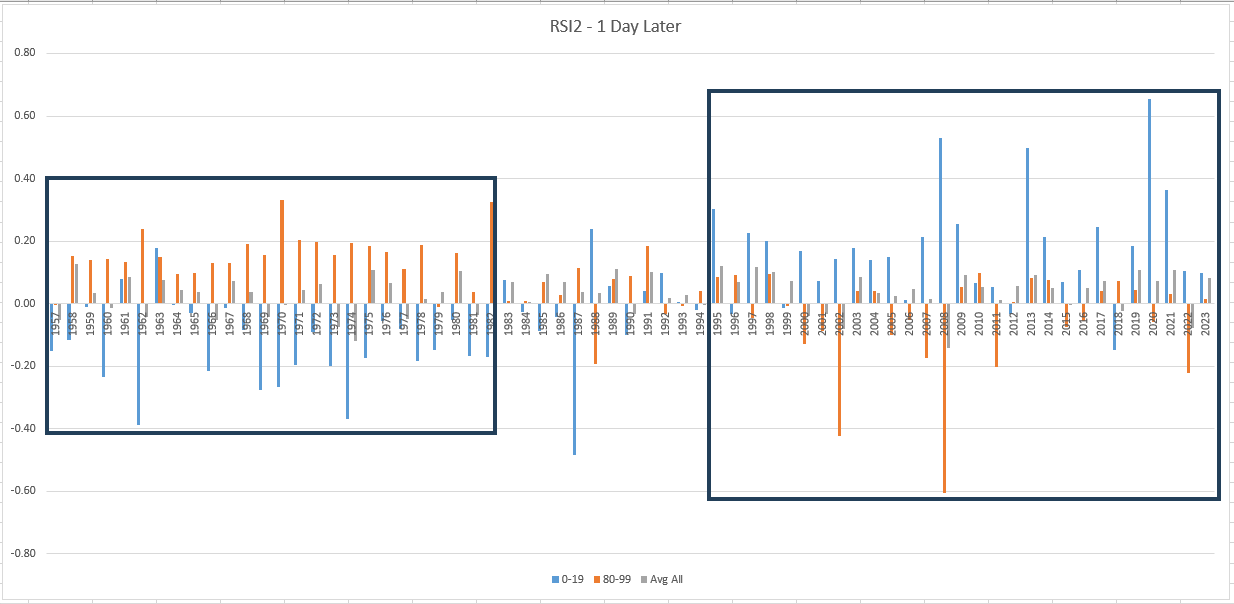
The blue bars “0-19” are the average one day return for all occurrences in a year where the RSI2 was less than 20. The orange bars “80-99” are the average one day return for all occurrences in a year where the RSI2 was greater than 80. The grey bars are the average one day return for all days in a year.
This was a very surprising chart for me. I did not expect to see this so clearly. From 1957 to 1982, high RSI readings were followed by up days, while low RSI readings were followed down days. Then from 1983 to 1994 the behavior became erratic. Then from 1995 until now, the behavior flipped.
Comparing to Base
Another way of plotting the data is to subtract the average of all days from the average return of the target days. For Example, in 2020 the average return for low RSI days was .65. The average return for all days was .07. For 2020, we plot .58 which is .65 minus .07. I think of this as “excess performance”.
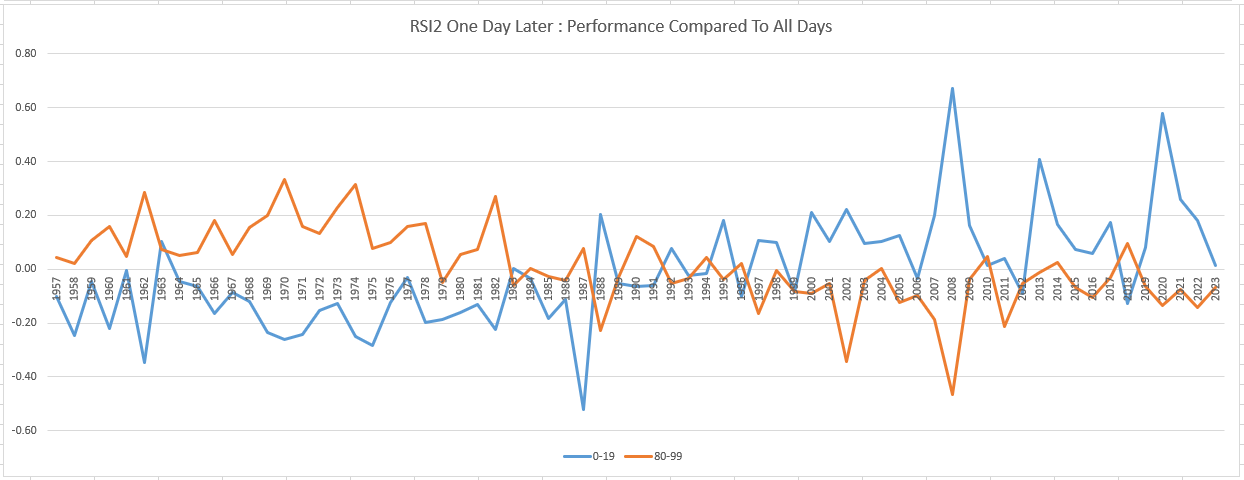
The Excess Performance chart above shows the same pattern, but even more clearly than with the previous method.
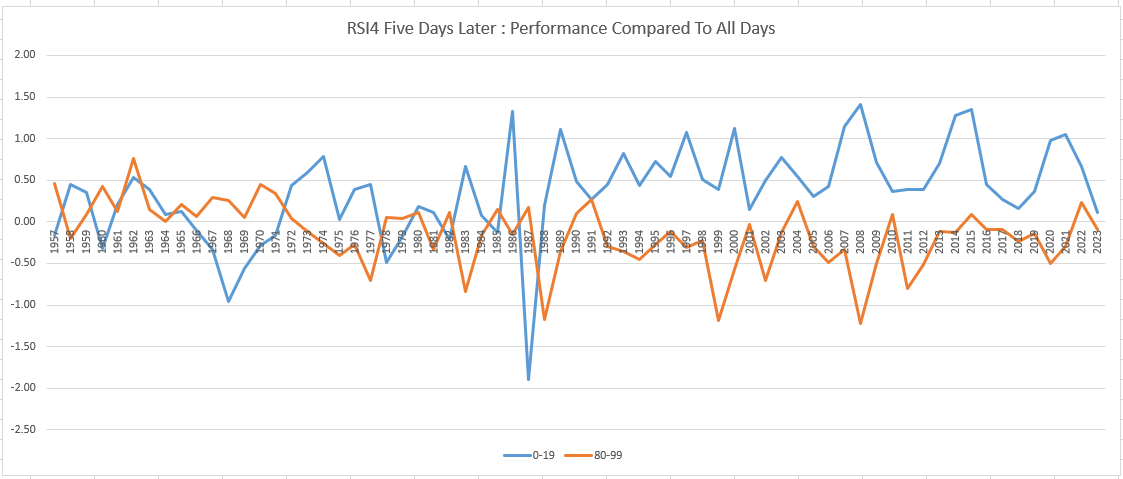
2-Period RSI Five Days Later
Depending on the exit rule, mean reversion strategies typically hold between 1-6 days. There was a clear pattern with a one day hold. Would it still be there five days later?
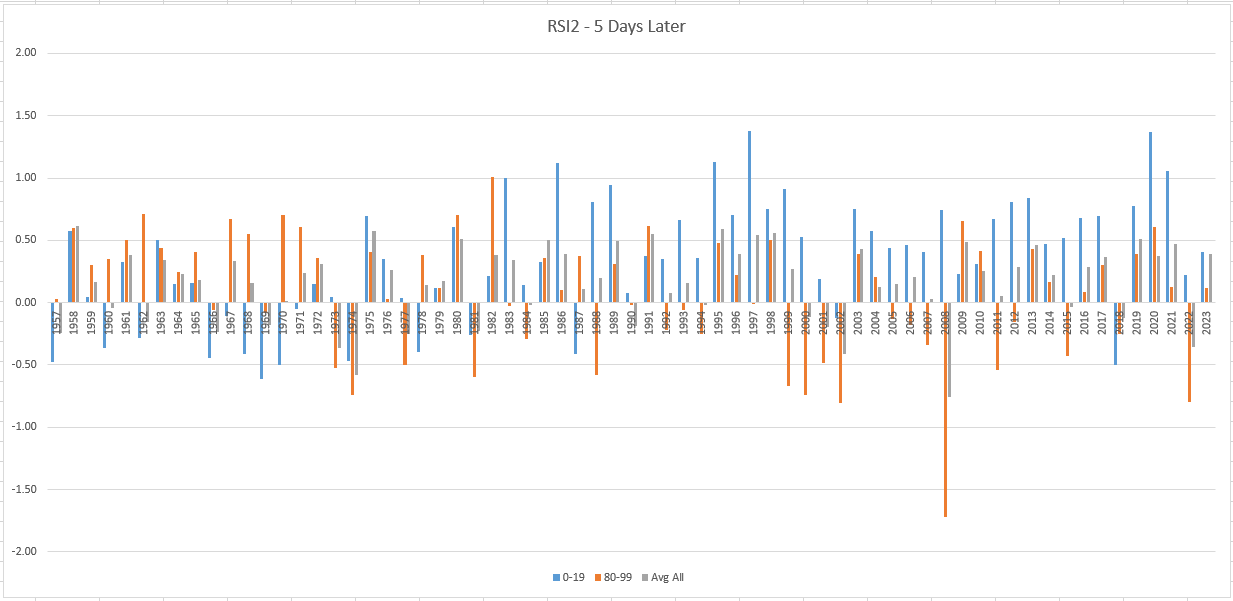
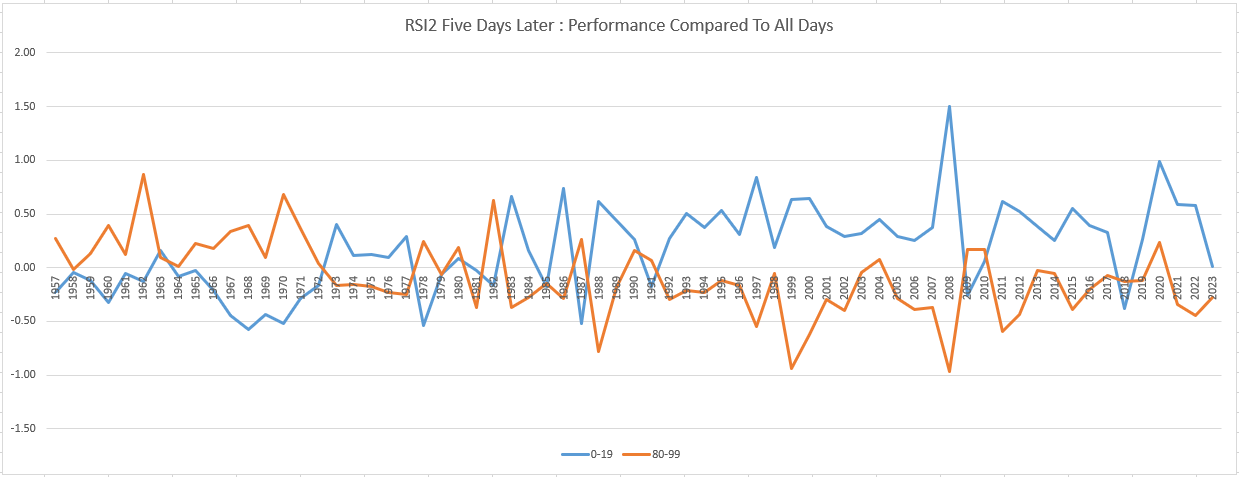
Now from the data it appears to mean reversion has been out-performing since 1983, with only a couple of years where it under-performs either overbought (RSI2 > 80) or the base.
Why the change in behavior? My story in hindsight is going to be computers. Computers were becoming more commonly accessible then and people could start running analysis on the markets.
4-Period RSI Five Days Later
One of the first strategies I tested for Larry Connors in 2003 was a low 4-period RSI reading on the index with an exit rule that typically had a five day hold.
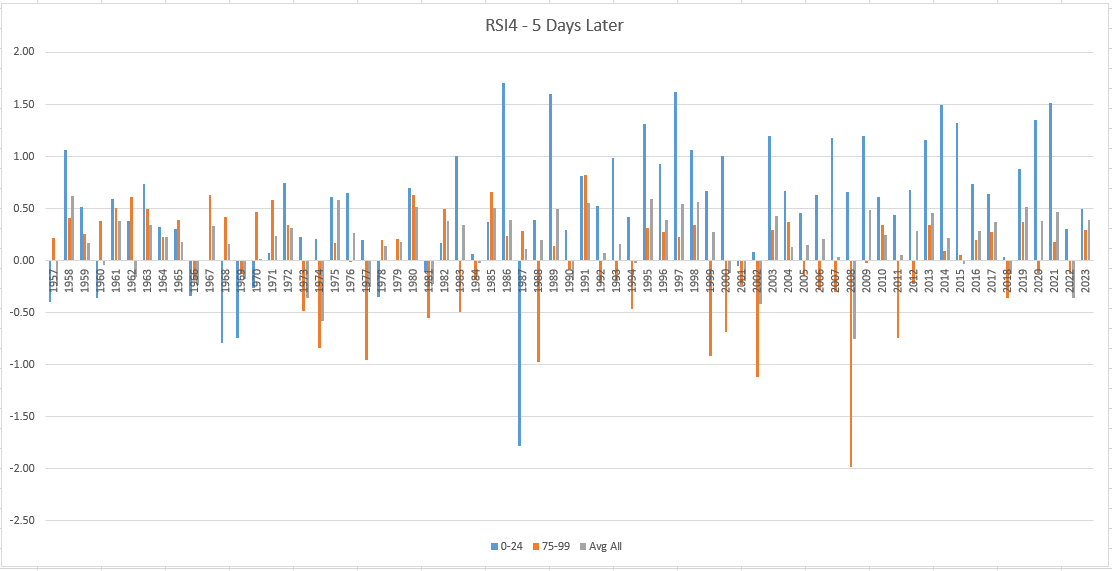
Before 1983, there is no clear pattern from the data. From about 1983, buying an oversold index outperformed the market over the next five days.
Rolling 5 year average
Now to the question I wanted to answer. How do low RSI returns compare to the past? To determine this, I took a five year rolling average of RSI(0-19) minus the base.
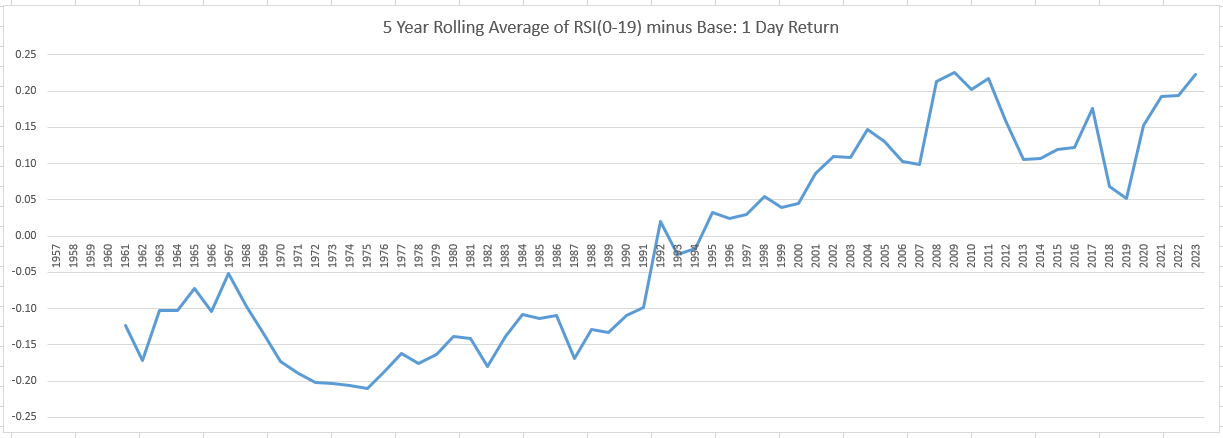
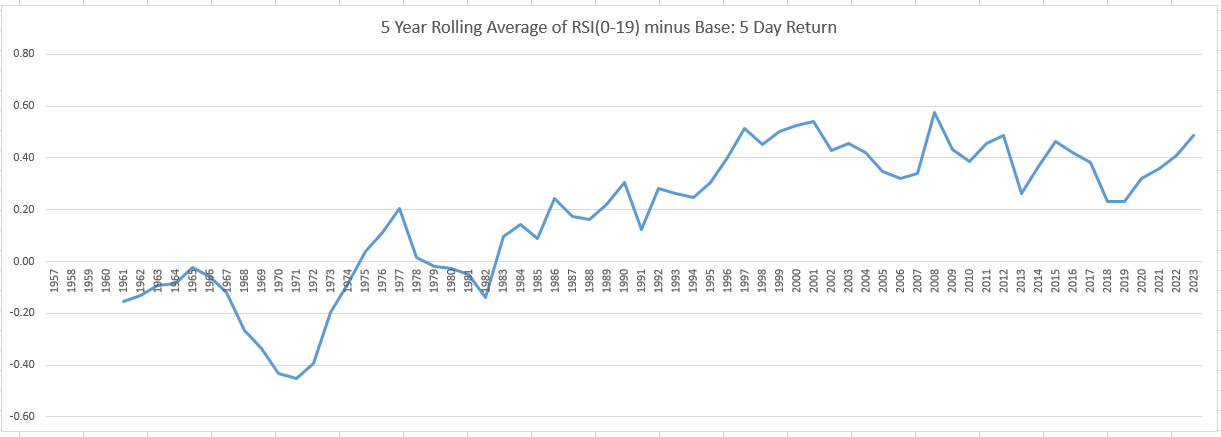
Looking at both the 1 and 5 day returns, there is little change from the mid-2000s which were a great time to be trading mean reversion.
Spreadsheet
Fill in the form below to get the spreadsheet with the data and charts.
Final Thoughts
This was a fun exercise. It is interesting to see how overbought and oversold performance has changed since 1957. I was surprised to see that mean reversion on the index has changed little since the mid-2000s, although year-to-year performance has its ups and downs An important thing to remember is these results on the index do not necessarily translate to stocks.
This was the easier post to do the research for. About a year ago I wrote Mean Reversion Check Up 2022 which looks at this issue using stock data. I commented then about edges getting smaller but both the long and short mean reversion strategies I trade performed well in 2023. Maybe mean reversion performance is reverting to the mean?
Backtesting platform used: AmiBroker. Data provider: Norgate Data (referral link)
Good quant trading,

Fill in for free spreadsheet:

