Category Archives for "Mean Reversion"
My preferred chart style is a candlestick chart but I have never investigated candlestick formations to see if they can help provide an edge in my trading. I recently ran into this blog post, Do Candlesticks Work? A Quantitative Test Of 23 Candlestick Formations, where he did his own investigation. Even better he shared the code for the formations in AmiBroker which would make it a lot easier. You can get my version of the code below.
Using the mean reversion strategy from my previous post, I wanted to know if any of the candlestick formations could improve the results.
Should you avoid trades that have recently gapped? What if you are trading a mean reversion strategy and a stock has recently had a large gap? Is that a good trade to take? Avoid? Does it depend on the direction of the gap? I did research on this about 15 years ago. Let’s see what the current research says.
Recently, I have been working on a strategy that trades stocks with low dollar turnover. The initial performance was attractive and I was liking the strategy. But there were two issues that I needed to deal with in the backtesting. How much slippage to add to these stocks. The strategy enters and exits on the open and while looking over the trade list, I noticed some trades entered at the low of the day and exited at the high of the day. From my trading, I knew this would not be a realistic price. Should these cases get extra slippage? What follows is how I try to account for these issues.
I had a long-time reader, Cristian Franchi, send me a mean-reversion strategy that he wanted me to test and write about. What caught my attention was the rules differing from what I typically see and use. Different ways of measuring strength of a sell-off and volatility expansion. Along with a different type of exit being used on a mean reversion strategy. Not simply waiting for the bounce.
While doing research on a mean reversion strategy, I was really happy with the Compounded Annual Returns (CAR) of 51%. I was thinking, I may have a new strategy to add to my stable of trading of trading strategies. A big fact I liked was the strategy used no market regime filter.
Then I looked at the yearly returns. The 2020 return through July 31 as 444%! How much did the CAR depend on this year’s numbers?
When developing a strategy, exits are often not given a second thought. If you are creating a mean reversion, you may default to using Close greater than the 2-period RSI. If you are trading a trend strategy, you may default to trailing exit using 14-day ATR. You try a bunch of entry filters but rarely try a different exit. Or maybe a slight change in the exit.
If you are having success, with your strategy. You think great and don’t change the exit. If you are not getting anywhere, you think the idea did not work and stop testing.
A slight change in your exit can have a huge impact on the results as was driven into me during some recent research. I am guilty of not be as thorough in my testing of exits as I should be. Hopefully, this will convince you to look at them more at the beginning of your research.
Most of us focus our research time looking to find better entries. We don’t spend enough time thinking about our exits. I am definitely guilty of this. A popular way to enter a mean reversion trade is by using a limit order. I use that on the strategy on RSI2 Strategy: Double returns with a simple rule change post.
The exit on that strategy is on the open. Many people don’t like exiting on the open because of the volatility and the belief that you will get a bad fill. What if we exit instead using limit orders? I tested this idea years ago. Time to revisit an old idea.

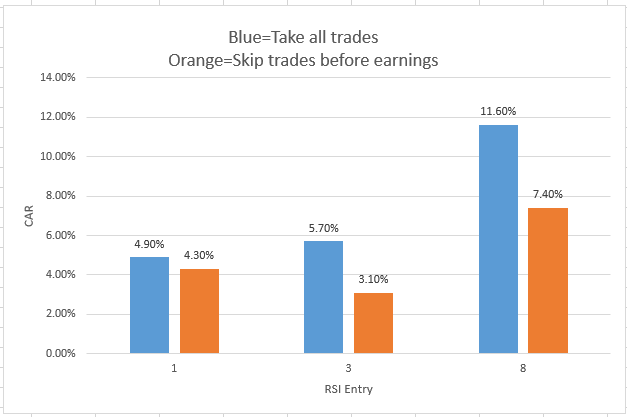
Over my last 16 years of research, one of the most asked questions is should you not take trades before an earnings release. I could never answer this question because I did not have the data. I can easily recall trades were a stock came out with poor earnings and crashed 25%. But without testing this, I would still take stocks into earnings. Because that is how the testing was done.
A few months ago, I discovered that Quantopian has data for the earnings dates for stocks. I had been looking for a good reason to try out Quantopian and this looked like a good project.
A common question I get from readers is “does mean reversion still work?” The last time I wrote about this topic was in 2015, a long time ago, in the post “The Health of Stock Mean Reversion: Dead, Dying or Doing Just Fine” I did not realize it had been so long. Time to look at it again.
Date Range: 1/1/2001 to 12/31/2018
Entry:
Exit:
Overall the last few months, I’ve had several consulting client’s strategy use SCTR for either a ranking or a filter. I finally got curious about the predictive ability of SCTR. How good is? I could find no information on how each of the ranking buckets did X days later on StockCharts.com. Maybe these results are hidden behind the paywall which I do not have access to.
I developed PowerRatings for TradingMarkets.com and understand how hard it is to make a ranking indicator that works. Is SCTR an indicator I should be using for medium to longer term strategies? What will the numbers to us?
9/19/2018: Make sure and read my follow up post, StockCharts Technical Rank (SCTR) Rotation Strategy, where the results are very different.