Category Archives for "Research"

A popular method for determining if a strategy should be kept trading is trading the equity curve. What this means we apply an indicator, say 200-day moving average, to the equity curve. When the equity curve falls below this value we stop trading. We then continue to paper trade the strategy until it gets above the moving average and then trade it live again. The general idea being that you get out when the strategy is doing poorly and get back in when it is doing well. Also once a strategy breaks, this gives you a simple way of getting out of it.
Imagine the following. You spent time developing a strategy with a compounded annual return of 24% and max drawdown of 18%. Profitable 10 of the last 11 years. An average 21 day rolling correlation with the SPY of .20. Passes your out-of-sample testing. Passes your parameter sensitivity testing. Raise your hand if you would trade this? I would be the guy jumping up and down saying “yes!”.
Now you trade the strategy and the first year you lose money. Do you stop trading it or keep going? What about after two years, your average return is only 11%, half the backtested results? Do you stop trading it or keep going?
I would have a hard time trading it after two years. I can say I have done this before with strategies. Here is the issue, the above one year and two year scenarios are quite possible.
A mean reversion strategy I trade was developed with another researcher. This strategy enters on a further intraday weakness with a limit order and typically exits a few days later when the stock bounces. Recently this researcher sent me and email saying “Try the strategy as a day trade. Enter at the open and exit at the close. Surprisingly good results.”
A common question I get is where do I find all my research ideas. My main source is Quantocracy. He does a great job of curating posts because the work is manually done. Then there the Better System Trader and Trend Following Radio podcasts. Usually from these sources I get a nugget of an idea to research or a simple strategy. Sometimes the post/podcast will recommend a book.
From one of these sources came the recommendation of the book “Trade Like A Stock Market Wizard” by Mark Minervini. Fortunately for me, my local library carried it. The strategy he covers in the book is a mixed of fundamentals, chart reading and technical analysis. Not something I would normally care about. I really enjoyed the chapters on risk management. In one chapter, he has very specific technical rules that all stocks must follow. On seeing this, I wondered could these rules be a basis for a trend following stock strategy? My second thought was, there are lots of rules there. Are all the rules necessary? The latter question is what I will focus on this post.
Like all traders, I am always on the lookout for any new indicators better than the ones I am using. I have been using and promoting RSI2 since 2004 for mean reversion trading. I created the ConnorsRSI in 2012. Am I married to these indicators? No. If I find something ‘better’ I will drop them. I came across this article Battle of the oscillators, I had to try it out.
One thing to understand, is that each situation is different. An indicator that works great on ETFs may work not as well on futures. Also, each person has a different metric on what is ‘better.’
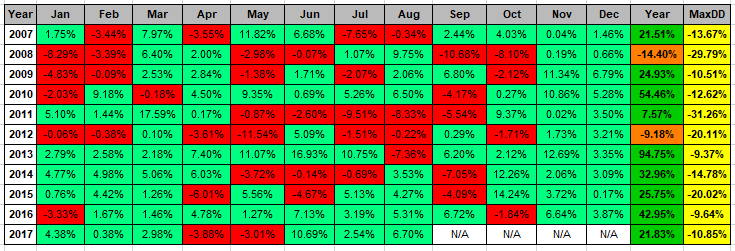
I recently had someone email me about the performance of a strategy I created back in late 2005/early 2006 and traded for a few years. I remember the strategy being a daily mean reversion set up with an intraday pullback entry. I figured it probably had not done well over the last decade. I stopped trading in the middle of 2008 because I did not like how it was behaving. In the backtest it did well in bear markets but was not doing so in the middle of 2008.
I ran the strategy from 2007, using the rules as they were published and was pleasantly surprised by the results. A CAR of 25%. Overall not too bad. Wish I had still been trading it. This is an eleven year out of sample test.
Continuing from the last post, I will show how using different definitions of passing our out-of-sample test can change our results. How luck can play a role if you use only one strategy to test out-of-sample. How you split your in-sample(IS) and out-of-sample(OOS) can change results.
As long time readers of my blog know, I often use a market timing indicator in my strategies. My favorite one, and a simple one, is using the 200 day moving average on either the SPY or S&P 500 Index. I recently ran into these posts, Using Market Breadth To Gauge Market Health (Part 5) and Matt’s Breadth Indicator. Matt’s Breadth Indicator (MBI) intrigued me because I had not seen something like this and conceptually it is simple. I also liked that it was not “easy” to test or optimize on. Therefore hopefully not many people would be using this indicator and I could potentially find better values.
In Simple ConnorsRSI Strategy on S&P500 Stocks I showed a ConnorsRSI strategy on S&P500 stocks. In ConnorsRSI Strategy: Optimization Selection, I narrowed down the optimization to three potential variations that one could consider trading. This post will explore Sensitivity Analysis (also known as: Parameter Sensitivity) to help guide us on what to expect from each variation.
In the previous post, Simple ConnorsRSI Strategy on S&P500 Stocks, I showed a simple strategy which I optimized which gave 1,300 variations. Today, I will cover various methods to choose a strategy to potentially trade.
