Category Archives for "Stocks"
We all have our favorite momentum indicators. One of mine is percent off 1 year high. This requires 252 data points and comparisons, plus a division. Another one is the 200-day moving average. This requires 200 closing prices, 199 additions and a division. A simple momentum indicator is Rate of Change which is the return of the asset of the last N days. This requires two prices and a division to calculate. That is simple. In this post I will show one that requires just one price and no math.

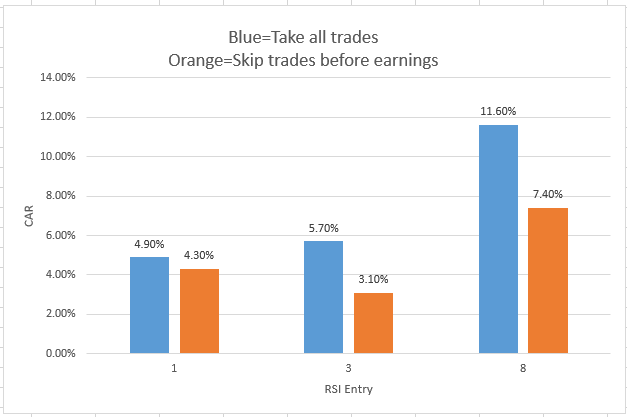
Over my last 16 years of research, one of the most asked questions is should you not take trades before an earnings release. I could never answer this question because I did not have the data. I can easily recall trades were a stock came out with poor earnings and crashed 25%. But without testing this, I would still take stocks into earnings. Because that is how the testing was done.
A few months ago, I discovered that Quantopian has data for the earnings dates for stocks. I had been looking for a good reason to try out Quantopian and this looked like a good project.
A common question I get from readers is “does mean reversion still work?” The last time I wrote about this topic was in 2015, a long time ago, in the post “The Health of Stock Mean Reversion: Dead, Dying or Doing Just Fine” I did not realize it had been so long. Time to look at it again.
Date Range: 1/1/2001 to 12/31/2018
Entry:
Exit:
I was recently at a NWTTA presentation about the “S&P 500 Dividend Aristocrats” and how to trade these stocks. The strategy was part quantitative and part discretionary. It was popular talk with lots of good questions. People always seem interested in dividend stocks but for me they are just another stock with another reason to go up or down. I don’t like to dismiss ideas without testing. The strategy relies on fundamental data that I do not have access to but I have dividend data from Norgate Data. Would that be enough to create a strategy worth trading?
My post last week on the analysis of SCTR produced lots of emails and comments with great ideas. One idea that I liked was a simple rotation strategy using SCTR. I mentioned in the post that maybe using SCTR as ranking method would produce different results.
Normally I don’t post this quickly but I wanted to share these new results because they give a different view of SCTR.
Overall the last few months, I’ve had several consulting client’s strategy use SCTR for either a ranking or a filter. I finally got curious about the predictive ability of SCTR. How good is? I could find no information on how each of the ranking buckets did X days later on StockCharts.com. Maybe these results are hidden behind the paywall which I do not have access to.
I developed PowerRatings for TradingMarkets.com and understand how hard it is to make a ranking indicator that works. Is SCTR an indicator I should be using for medium to longer term strategies? What will the numbers to us?
9/19/2018: Make sure and read my follow up post, StockCharts Technical Rank (SCTR) Rotation Strategy, where the results are very different.
While playing around with a 2 period RSI (Relative Strength Index) mean reversion strategy, I came up with a very simple rule change with a much larger impact on the results than expected. I doubled the compounded annual growth rate and cut the maximum drawdown in half. That never happens.
In my optimization runs the best CAR went from lows 10’s to the low 20’s with this rule change.
One of the first tests I did when I got AmiBroker twenty years ago was a mean reversion test. It was a classic set up, a stock in an uptrend, followed by a pullback. But the entry differed from what I do now. The entry waited for a confirmation of the trend back up. The trade would enter when the stock crossed above the previous day’s high. The exit was also different. The exit was on a close below the lowest low of the last (2,5) days. The results were not very good, so I gave up on it. I did not do test entering on the open or on further intraday pullback or exiting on the bounce. If I had, I would have started my mean reversion trading several years earlier, which would have added several more years of large edges trading. Oh well, I was just a beginner researcher then.
Recently I got curious about waiting for confirmation before entering a trade. Now that I know more about entries and exits, would it give good results. How would these results compare to waiting for further intraday pullback or entering at the open? Time to discover.
A reader emailed me about testing a weekly mean reversion rotation strategy on S&P500 stocks. My first thought was, why had I not done this type of test before? The very first strategy that I worked on with Larry Connors was this type of strategy. The strategy I will be testing today is a simpler version and different universe but how well will it hold up?
Testing period is from 1/1/2007 to 10/31/2017.
Setup
Each weekend, take all the stocks that have setup and then rank using one of the mean reversion methods below. Buy top 5 that are most sold off. Hold 1 week and sell. Then buy the ones that are now the most sold off
In the previous post, Simple ConnorsRSI Strategy on S&P500 Stocks, I showed a simple strategy which I optimized which gave 1,300 variations. Today, I will cover various methods to choose a strategy to potentially trade.