Author Archives: Cesar Alvarez

November 23, 2015
- in ETFs , Rotation by Cesar Alvarez
Five ETF Monthly Rotation Strategy
I was working on another blog post when I saw this post Inferences From Backtest Results Are False Before Proven True on Price Action Lab. Mike has a challenge to replicate a very simple test. I often get email from people trying to replicate results from one of my blog posts and thought this would be fun to do. I cover some of this topic on my post Backtesting is Hard.
November 11, 2015
- in Mean Reversion , Stocks by Cesar Alvarez
Hi-Lo Index as a Market Timing Indicator
My strategies use a market timing indicator to tell me when I should not be trading the strategy. The blog post, Avoiding Stock Market Crashes with the Hi-Lo Index of the S&P500, presented a very simple idea of using new highs vs new lows. The post tests trading the SPY & IEF but I wanted to know how well would it work on a S&P500 mean reversion strategy.
October 21, 2015
- in Mean Reversion , Stocks by Cesar Alvarez
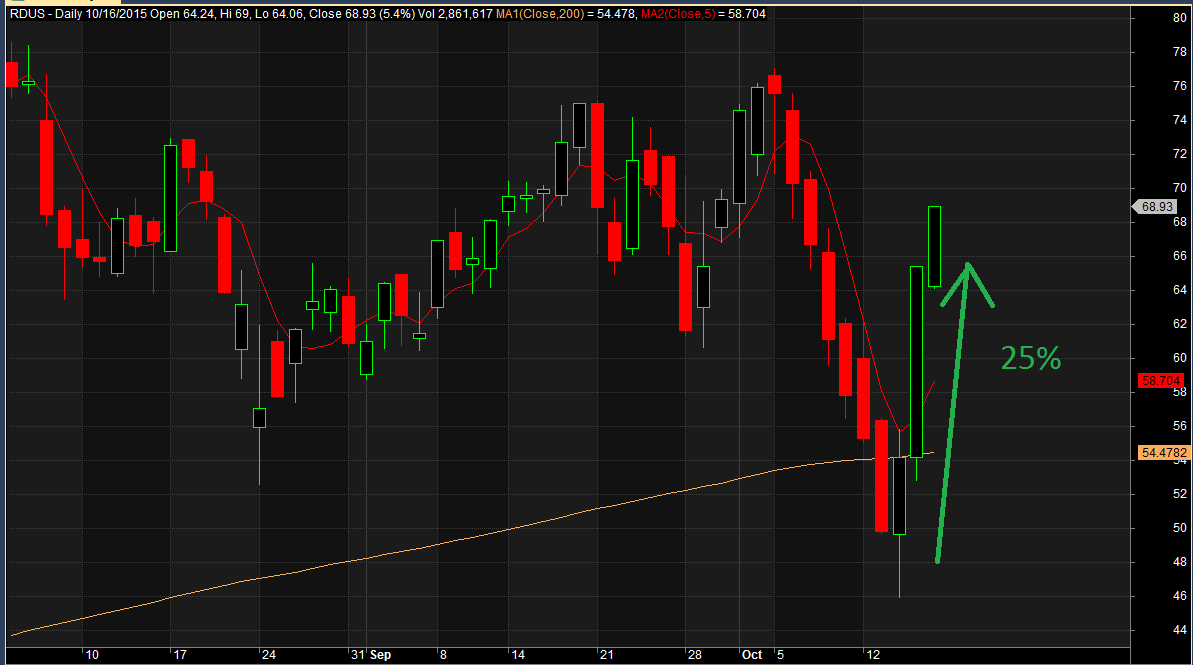
Biotech: My love-hate relationship
My love
My hate
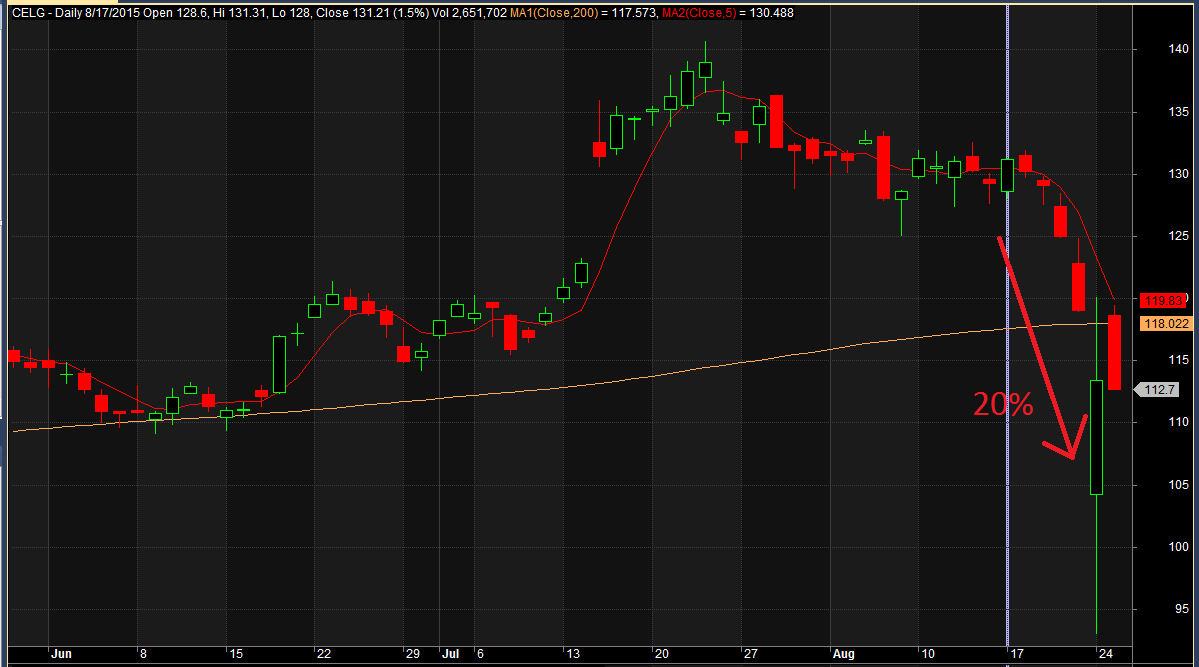
The two charts above are from recent trades I have taken. Charts created in AmiBroker.
On July 20, 2015 IBB, iShares Nasdaq Biotechnology ETF, made a closing high of 398. About three months later it closed at 289 for 27% loss. A very common thing I hear from traders is that they “don’t trade biotechnology or pharmaceutical stocks.” I completely understand. These stocks tend to be very volatile and news driven. But does removing these stocks really reduce your drawdowns? What happens to your Compounded Growth Rate? Time to see what the research shows us.
September 30, 2015
- in Mean Reversion , Stocks by Cesar Alvarez
Stop Losses and Profit Targets. Plus Happy Birthday Excel!
In the post, Maximum Loss Stops: Do you really need them?, we looked at how maximum loss stops changed the results of a mean reversion strategy. At the end of the post I asked the readers to vote for what to try next. Let us see how these are ideas turn out.
September 16, 2015
- in Mean Reversion , Research , Stocks by Cesar Alvarez
The Health of Stock Mean Reversion: Reader’s Ideas
My previous post The Health of Stock Mean Reversion: Dead, Dying or Doing Just Fine generated good reader’s suggestions on other ways to check on mean reversion health. Let us see what these tests tell us.
September 2, 2015
- in Good Reads by Cesar Alvarez
What I am reading: Sept. 2, 2015
Recent articles that I found interesting and made me think. For more articles see the quant mashup Quantocracy.
Was Monday’s ETF Collapse Just A Warmup?
“The ETF can’t be more liquid than the underlying, and we know the underlying can become highly illiquid.”
Computers are the new Dumb Money
“Rational, experienced people understood that an ETF with holdings that were down an average of 5% should not have a share price down 30%.”
Avoiding the Big Drawdown: Is Downside Protection Helpful or Heresy?
‘Chasing the Investing Unicorn: Give me “High Returns with Limited Risk”’
Algorithm Aversion — Why people don’t follow the model!
“However, given this knowledge that models beat experts, forecasters still prefer to use the human (expert) prediction as opposed to using the model.”
Good Quant Trading,

August 22, 2015
- in Research by Cesar Alvarez
How Unusual Is This Market Move?
Wow, what a tough week. But how unusual has this move been? I had a couple of readers send in some ideas to test. These are always fun tests to do when the market goes crazy but usually they don’t provide enough data points to act upon.
August 19, 2015
- in Mean Reversion , Research , Stocks by Cesar Alvarez
The Health of Stock Mean Reversion: Dead, Dying or Doing Just Fine
My second post on this blog was a look at mean reversion, Is mean reversion dead? Given I am using a new data provider(Norgate Data), it has been almost two years since that post and there have been other articles on this recently, I figured it was time to check again. The research will focus on Russell 1000 stocks since 1995. The test is back to 1995 covers 3 bull markets and 2 bear markets.
August 5, 2015
- in Mean Reversion , Research , Stocks by Cesar Alvarez
Maximum Loss Stops: Do you really need them?
We hear it all the time. “You must use stops.” And most of us use them. But do you know how they change your strategy results? Are they improving your results by giving you higher CAR or lower maximum drawdown? Recently I was speaking with a reader about this topic and he insisted that it you had to have stops to trade. Well, does one?
July 22, 2015
- in ETFs , Rotation by Cesar Alvarez
Multiple Time Frames for Scoring ETF Rotational Strategies
Today we have a guest post from David Weilmuenster who I worked with while at Connors Research.
A widely applied technique for scoring assets in rotational systems is to rank those assets by their price momentum, or return, over a given historical window and to rotate into the assets with higher momentum. This approach seeks to capitalize on the well-demonstrated tendency for price momentum to persist. But, it begs some questions:
- “What is an appropriate historical period for measuring price momentum?” Clearly, the momentum of a given asset can rank quite differently compared to the tradable universe over 1 month, 3 months, or 6 months.
- “Is one historical period sufficient?” If relative momentum can vary widely depending on the historical window, would it be better to consider multiple slices of history?
- Is higher momentum always preferable to lower momentum, especially if the system rules filter the tradable universe before scoring the ETFs for rotation?
