Author Archives: Cesar Alvarez

March 25, 2015
- in General by Cesar Alvarez
Speaking at the 2015 ATAA conference
I will be speaking at the 2015 Australian Technical Analysts Association on May 15 to 17, 2015. My topics are “The development of an S&P500 stock weekly rotation strategy” and “From Internet Article to Trading Strategy: An ETF Monthly Rotation Strategy.” For more information about the conference go here. I am excited to meet some of my readers at the conference.
I will have two free days to explore Sydney before the conference. If you have any suggestions on things to do and see (I will not have a car) or places to eat (from hole-in-the-wall to fancy) or hotel to stay at (want to stay in the heart of Sydney), put them in the comments.
On May 13th, I would like to get together with some of my Australian readers in Sydney. If you are interested in meeting either for dinner or drinks, please contact me. Depending on the size of the group it may just be drinks. Any suggestions on where to have the get together are appreciated. I plan to stay in the heart of Sydney but have not booked my hotel yet.
What is the must eat restaurant in the heart of Sydney? Put it in the comments below.
Good quant trading,

March 18, 2015
- in ETFs , Rotation by Cesar Alvarez
ETF Sector Rotation
My recent research has been in ETFs which I have not explored in several years. ETF sector rotation has always intrigued me. The idea seems so simple that it should work. Always be in the sector that has been doing the best. I like simple but does it work? If not, can we make it work?
March 4, 2015
- in ETFs , Mean Reversion by Cesar Alvarez
Developing Leveraged ETF Strategies
How should one develop a strategy for leveraged ETFs? Do you develop the strategy on the unleveraged ETF and then apply the rules to the leveraged ETF? Or do you develop the strategy on the leveraged ETF directly? Or do you develop the strategy on the unleveraged ETF then use signals on that to trade the leveraged ETF? On first blush one would think that all three methods would produce identical results. But as we know, the obvious is rarely the right thing for strategy development.
February 11, 2015
- in Good Reads by Cesar Alvarez
What I am reading: Feb 11, 2015
Recent articles that I found interesting and made me think.
S&P 500 Snapshot: Check out the ‘A Perspective on Drawdowns’ to see how shallow drawdowns have been overall since 2009.
This Is The Best Illustration Of History’s Bull And Bear Markets We’ve Seen Yet – A longer term look at the markets. Our current bull market does not look so great compared to others. I am sucker for pretty charts if you could not tell.
Missing What is Missing – A good TED talk about survivorship bias outside the trading world with plenty of application back to the trading world.
Mindfulness, meditation and investing – I thought that I would never do it but I started practicing mindfulness about 2-3 months ago and have been surprised by thoughts that jump into my head.
Good Quant Trading,
January 28, 2015
- in Stocks , Trend Following by Cesar Alvarez
Trading stock splits
Trading stock splits is something that I have read about for long time but never researched. This article, A simple way to beat the market with stock splits, caught my eye and gave me the push to investigate the topic. This falls into the category of a topic I have heard a lot about that I can’t believe that it would work but as always one must test. One never knows.
January 14, 2015
- in Rotation , Stocks by Cesar Alvarez
Using 52-week highs in a S&P500 monthly rotation strategy
One area of recent interest for me is trading rotational strategies on a monthly timeframe using S&P500 stocks and ETFs. Areas of exploration include Momentum and Dual Momentum. Recently I came across The Secret to Momentum is the 52-Week High??? on Alpha Architect, a blog I highly recommend on reading along with the quant mashup Quantocracy.. The article is a synopsis of research done comparing momentum vs. 52-week highs as ranking filters for a rotation strategy. A new idea I had not tried. What a great way to start the year, testing a new idea. Even though often they do not work out, one needs to be exploring all the time.
December 17, 2014
- in ETFs , Rotation by Cesar Alvarez
Day of month pattern or luck for a monthly ETF rotation strategy?
From my post on Heikin-Ashi Charts, another researcher wrote Luck: The Difference Between Hired or Fired about how luck of the draw could account for the difference in returns depending on the starting date. This is a completely valid question. Are three better returns for a strategy in a particular area of the month or is it random? I do believe that luck plays a large part in our trading results, which is a future blog post. But from previous work on 5 day holds, I know that the end of the month and beginning on the month tend to be better times for ETF mean reversion.
December 1, 2014
- in Research by Cesar Alvarez
SPX breaks record of closing above five day moving average
How strong is this market? The SP-500 index had closed above its five day moving average for 29 days and on Friday it finally closed below it. The last day it closed under the five day moving average was on October 16, 2014. This is the longest streak since 1963 (that is as far back as my data goes). The old record was 26 days in 1986. The previous best streak in the last decade was 19, which has been crushed. The index has not had a short-term pullback in the last month which is tough for a short-term mean reversion trader.
The question that always follows is what happens when the streak is broken. We will see what happens if one enters at the close the day the streak is broken and then exit 5 days, 1 month, 3 months and 6 months later.
November 19, 2014
- in ETFs , Trend Following by Cesar Alvarez
Heikin-Ashi Charts
A reader recently introduced me to Heikin-Ashi charts. Popular with forex traders for showing trends which at first look of chart sure seems that way. Look at these two daily charts. The top one is a standard Candlestick chart while the bottom is Heikin-Ashi chart.
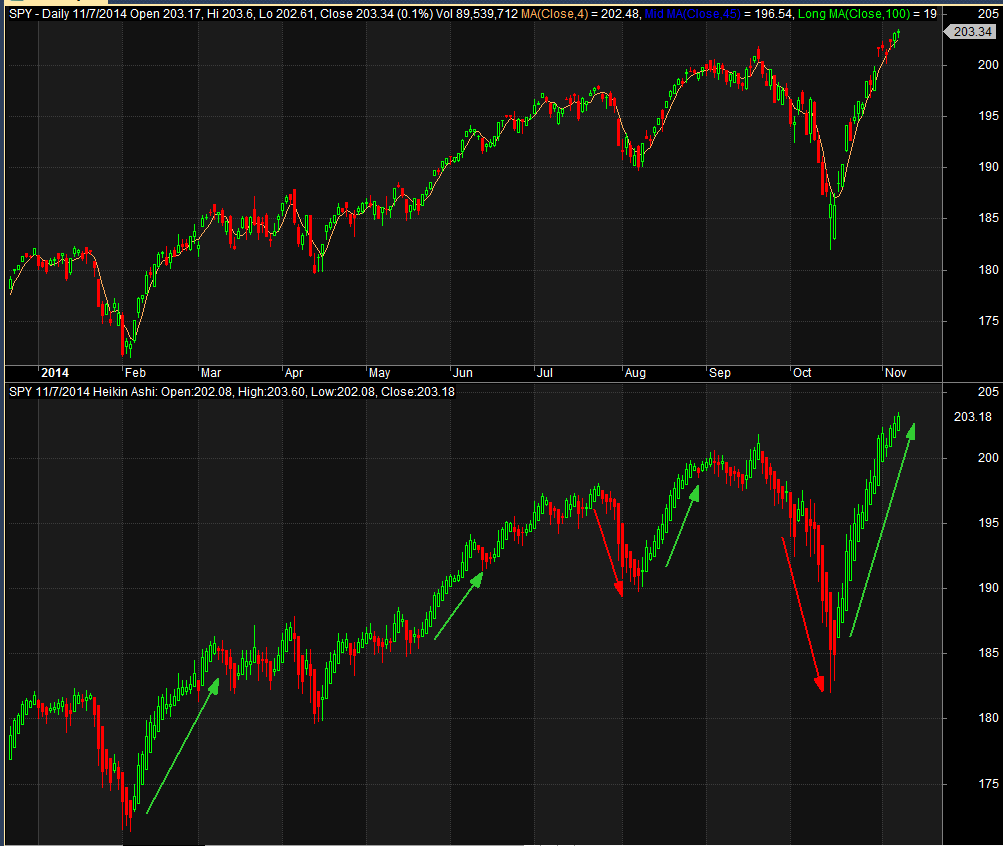
The trend of unbroken green sure seems more obvious and stronger in the Heikin-Ashi chart. Will testing confirm this?
November 3, 2014
- in Mean Reversion , Research , Stocks by Cesar Alvarez
Monte Carlo Analysis in AmiBroker
This post will cover in detail two different ways of doing Monte Carlo analysis and the code needed to it in AmiBroker. A reader recently sent me this article, Monte Carlo Analysis For Trading Systems. The article covers three methods of Monte Carlo analysis. One of which I had never thought about and I had to slap my head on how simple it was.
