Author Archives: Cesar Alvarez

December 5, 2018
- in General by Cesar Alvarez
The Emotional Quant Curve
While writing my presentation for TradersFest 2018, I wanted to add the trader’s emotional curve. But looking at it closer, it did not capture my feelings as I go through the cycle of up and downs of trading a strategy. Here is my curve.
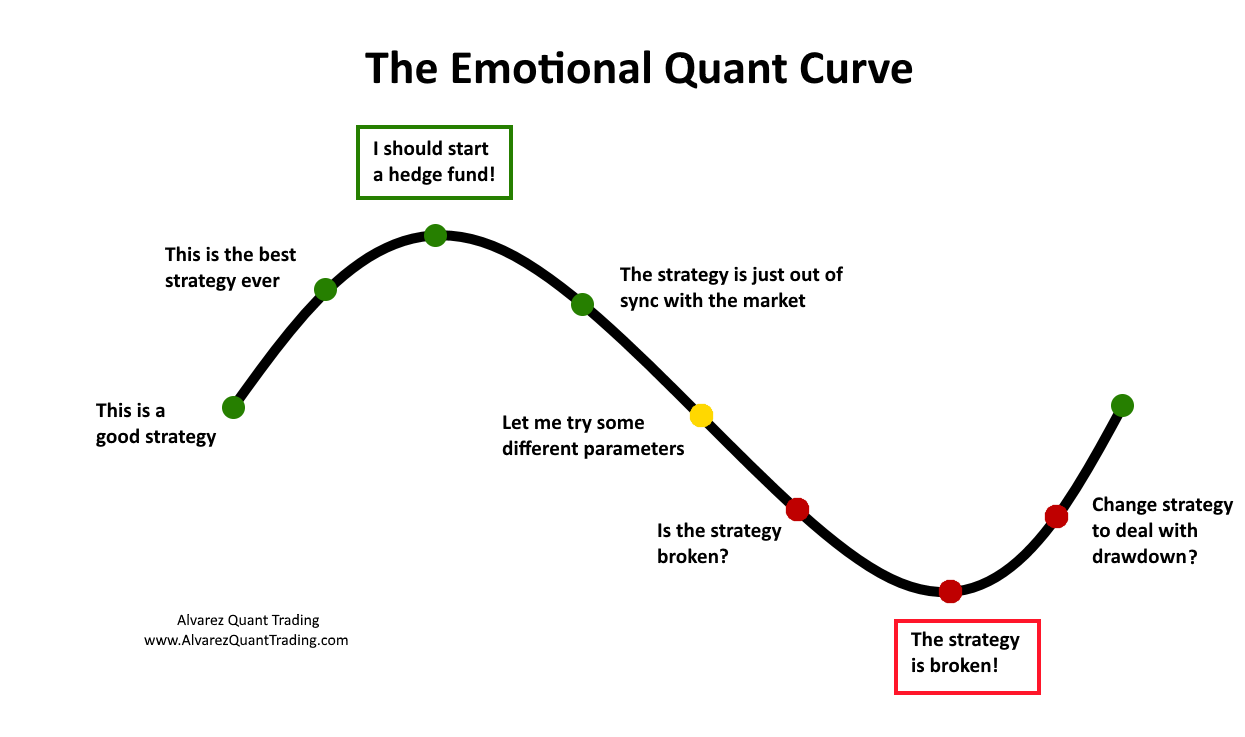
I have been on every part of this curve multiple times. October and November caused several strategies to go into the red part of the curve.
The top box of the curve, “I should start a hedge fund!” does not apply to me since I do not want to manage money. But lots of traders think about it and I chose that. For me, I would have changed it to “I can retire!”
Where are your strategies right now?
Good quant trading,

November 28, 2018
- in Research , Trend Following by Cesar Alvarez
Stiffness Indicator Analysis
A reader pointed me the November 2018 issue of Technical Analysis of Stocks & Commodities to an article about a trend following indicator on S&P500 stocks. I liked the concept of the indicator and the article had backteted results and AmiBroker code. How could I resist not looking into this?
Little did I realize this would lead to Backtesting is Hard and How much does not having survivorship free data change test results?.
November 21, 2018
- in General by Cesar Alvarez
Upcoming presentation: Getting started in Quantified Trading
I will be giving a free online presentation, Getting started in Quantified Trading with a mean reversion strategy, at TradersFest 2018 on December 11, 2018. What to see my presentation?
Then sign up for TradersFest 2018.
It’s a FREE 2-day online event where you’ll learn trading strategies & techniques.
Topics from other presenters:
- Quantitative trading for retail traders
- How to develop a killer trading instinct
- How to trade Options for profit and protection
- How to find winning stocks in good times and bad
- How to level up your trading and become a confident trader — even if you’ve been losing for years
Topics that I will cover include:
- What is quant trading and what it is not
- Tools of the trade
- The importance of strategy goals
- The creation of a mean reversion strategy
- Rules that keep you trading
- Needing a trading buddy
- And much more…
If you want to join TradersFest, then click the link below and claim your spot (it’s free).
Here’s the link ==> Yes, Reserve My Spot!
See you at TradersFest!
Good quant trading,
October 28, 2018
- in Research by Cesar Alvarez
Missing the best or worst market days
This morning I saw the chart on Ritholz.com of what happens when you miss the best X days of the market. I see a variation of this chart often and is used to argue why someone should not try and time the market. One concept I like to do is to invert. Meaning try the opposite idea and see what you get. What I rarely see is the chart if you missed the worst X days. Given it is a rainy Sunday morning here in Seattle and I had nothing better to do, I wanted to see that chart.
October 17, 2018
- in Research , Rotation , Stocks by Cesar Alvarez
Backtesting a Dividend Strategy
I was recently at a NWTTA presentation about the “S&P 500 Dividend Aristocrats” and how to trade these stocks. The strategy was part quantitative and part discretionary. It was popular talk with lots of good questions. People always seem interested in dividend stocks but for me they are just another stock with another reason to go up or down. I don’t like to dismiss ideas without testing. The strategy relies on fundamental data that I do not have access to but I have dividend data from Norgate Data. Would that be enough to create a strategy worth trading?
September 19, 2018
- in Rotation , Stocks by Cesar Alvarez
StockCharts Technical Rank (SCTR) Rotation Strategy
My post last week on the analysis of SCTR produced lots of emails and comments with great ideas. One idea that I liked was a simple rotation strategy using SCTR. I mentioned in the post that maybe using SCTR as ranking method would produce different results.
Normally I don’t post this quickly but I wanted to share these new results because they give a different view of SCTR.
September 12, 2018
- in Mean Reversion , Research , Stocks , Trend Following by Cesar Alvarez
StockCharts Technical Rank (SCTR) Indicator Analysis
Overall the last few months, I’ve had several consulting client’s strategy use SCTR for either a ranking or a filter. I finally got curious about the predictive ability of SCTR. How good is? I could find no information on how each of the ranking buckets did X days later on StockCharts.com. Maybe these results are hidden behind the paywall which I do not have access to.
I developed PowerRatings for TradingMarkets.com and understand how hard it is to make a ranking indicator that works. Is SCTR an indicator I should be using for medium to longer term strategies? What will the numbers to us?
9/19/2018: Make sure and read my follow up post, StockCharts Technical Rank (SCTR) Rotation Strategy, where the results are very different.
August 22, 2018
- in Data by Cesar Alvarez
Pre-inclusion Bias: How to create a false strategy
In the previous post I described a simple rule to double the returns of a mean reversion strategy. In this post, I show how pre-inclusion bias can take a losing strategy and make it a winning one.
Recently I had reader send me the rules for a stock trend following strategy. He knew these are the strategies I have been researching lately. The rules were few and I had time, so I coded it up.
August 1, 2018
- in Mean Reversion , Stocks by Cesar Alvarez
RSI2 Strategy: Double returns with a simple rule change
While playing around with a 2 period RSI (Relative Strength Index) mean reversion strategy, I came up with a very simple rule change with a much larger impact on the results than expected. I doubled the compounded annual growth rate and cut the maximum drawdown in half. That never happens.
In my optimization runs the best CAR went from lows 10’s to the low 20’s with this rule change.
July 11, 2018
- in General , Research by Cesar Alvarez
Buy The Fear, Sell The Greed
The last few months, I have been busy doing research for Larry Connors’ new book, Buy The Fear, Sell The Greed. As always, it is fun and challenging to research for a book.
The book has seven strategies, trading both ETFs and stocks, with full rules and results. They are:
- RSI Power Zones: Long ETF strategy
- Crash: Short Stock strategy
- Vol Panics: Short VXX strategy
- VXX Trend Following: Short VXX strategy with over two month holds
- Trading New Highs: Long Stock strategy
- TPS: Long ETF strategy. Short ETF strategy
- Terror Gaps: Long ETF strategy.
My favorite strategy is Crash because it is very similar to the short strategy I trade now. Those trades are hard to take. For each strategy there are good example trades and explanations of what the market was doing then.
Get the first chapter by clicking here.
The book is coming soon to Amazon.
Good quant trading,
